
Clustering Student Profiles Using PASEC 2019 Data
🌌 The Curse of Dimensionality in Education Data Analysis
When developing effective education policies, it’s not enough to focus solely on student scores. Socioeconomic conditions, home environment, and school infrastructure all play a crucial role in shaping academic outcomes. But as the number of variables increases, the data space becomes too complex—this is the curse of dimensionality.
To address this, I used unsupervised machine learning techniques to cluster students into meaningful profiles based on:
- Academic performance (reading & math)
- Household conditions (electricity, books, hunger)
- School environment (infrastructure, meals)
🧠 Methodology
- Clustering algorithm: DBSCAN (Density-Based Spatial Clustering of Applications with Noise)
- Dimensionality reduction: PCA (Principal Component Analysis)
- Data: PASEC 2019 standardized student assessment datasets
- Tools: Python (
sklearn,matplotlib,seaborn,pandas)
📊 Key Visualizations
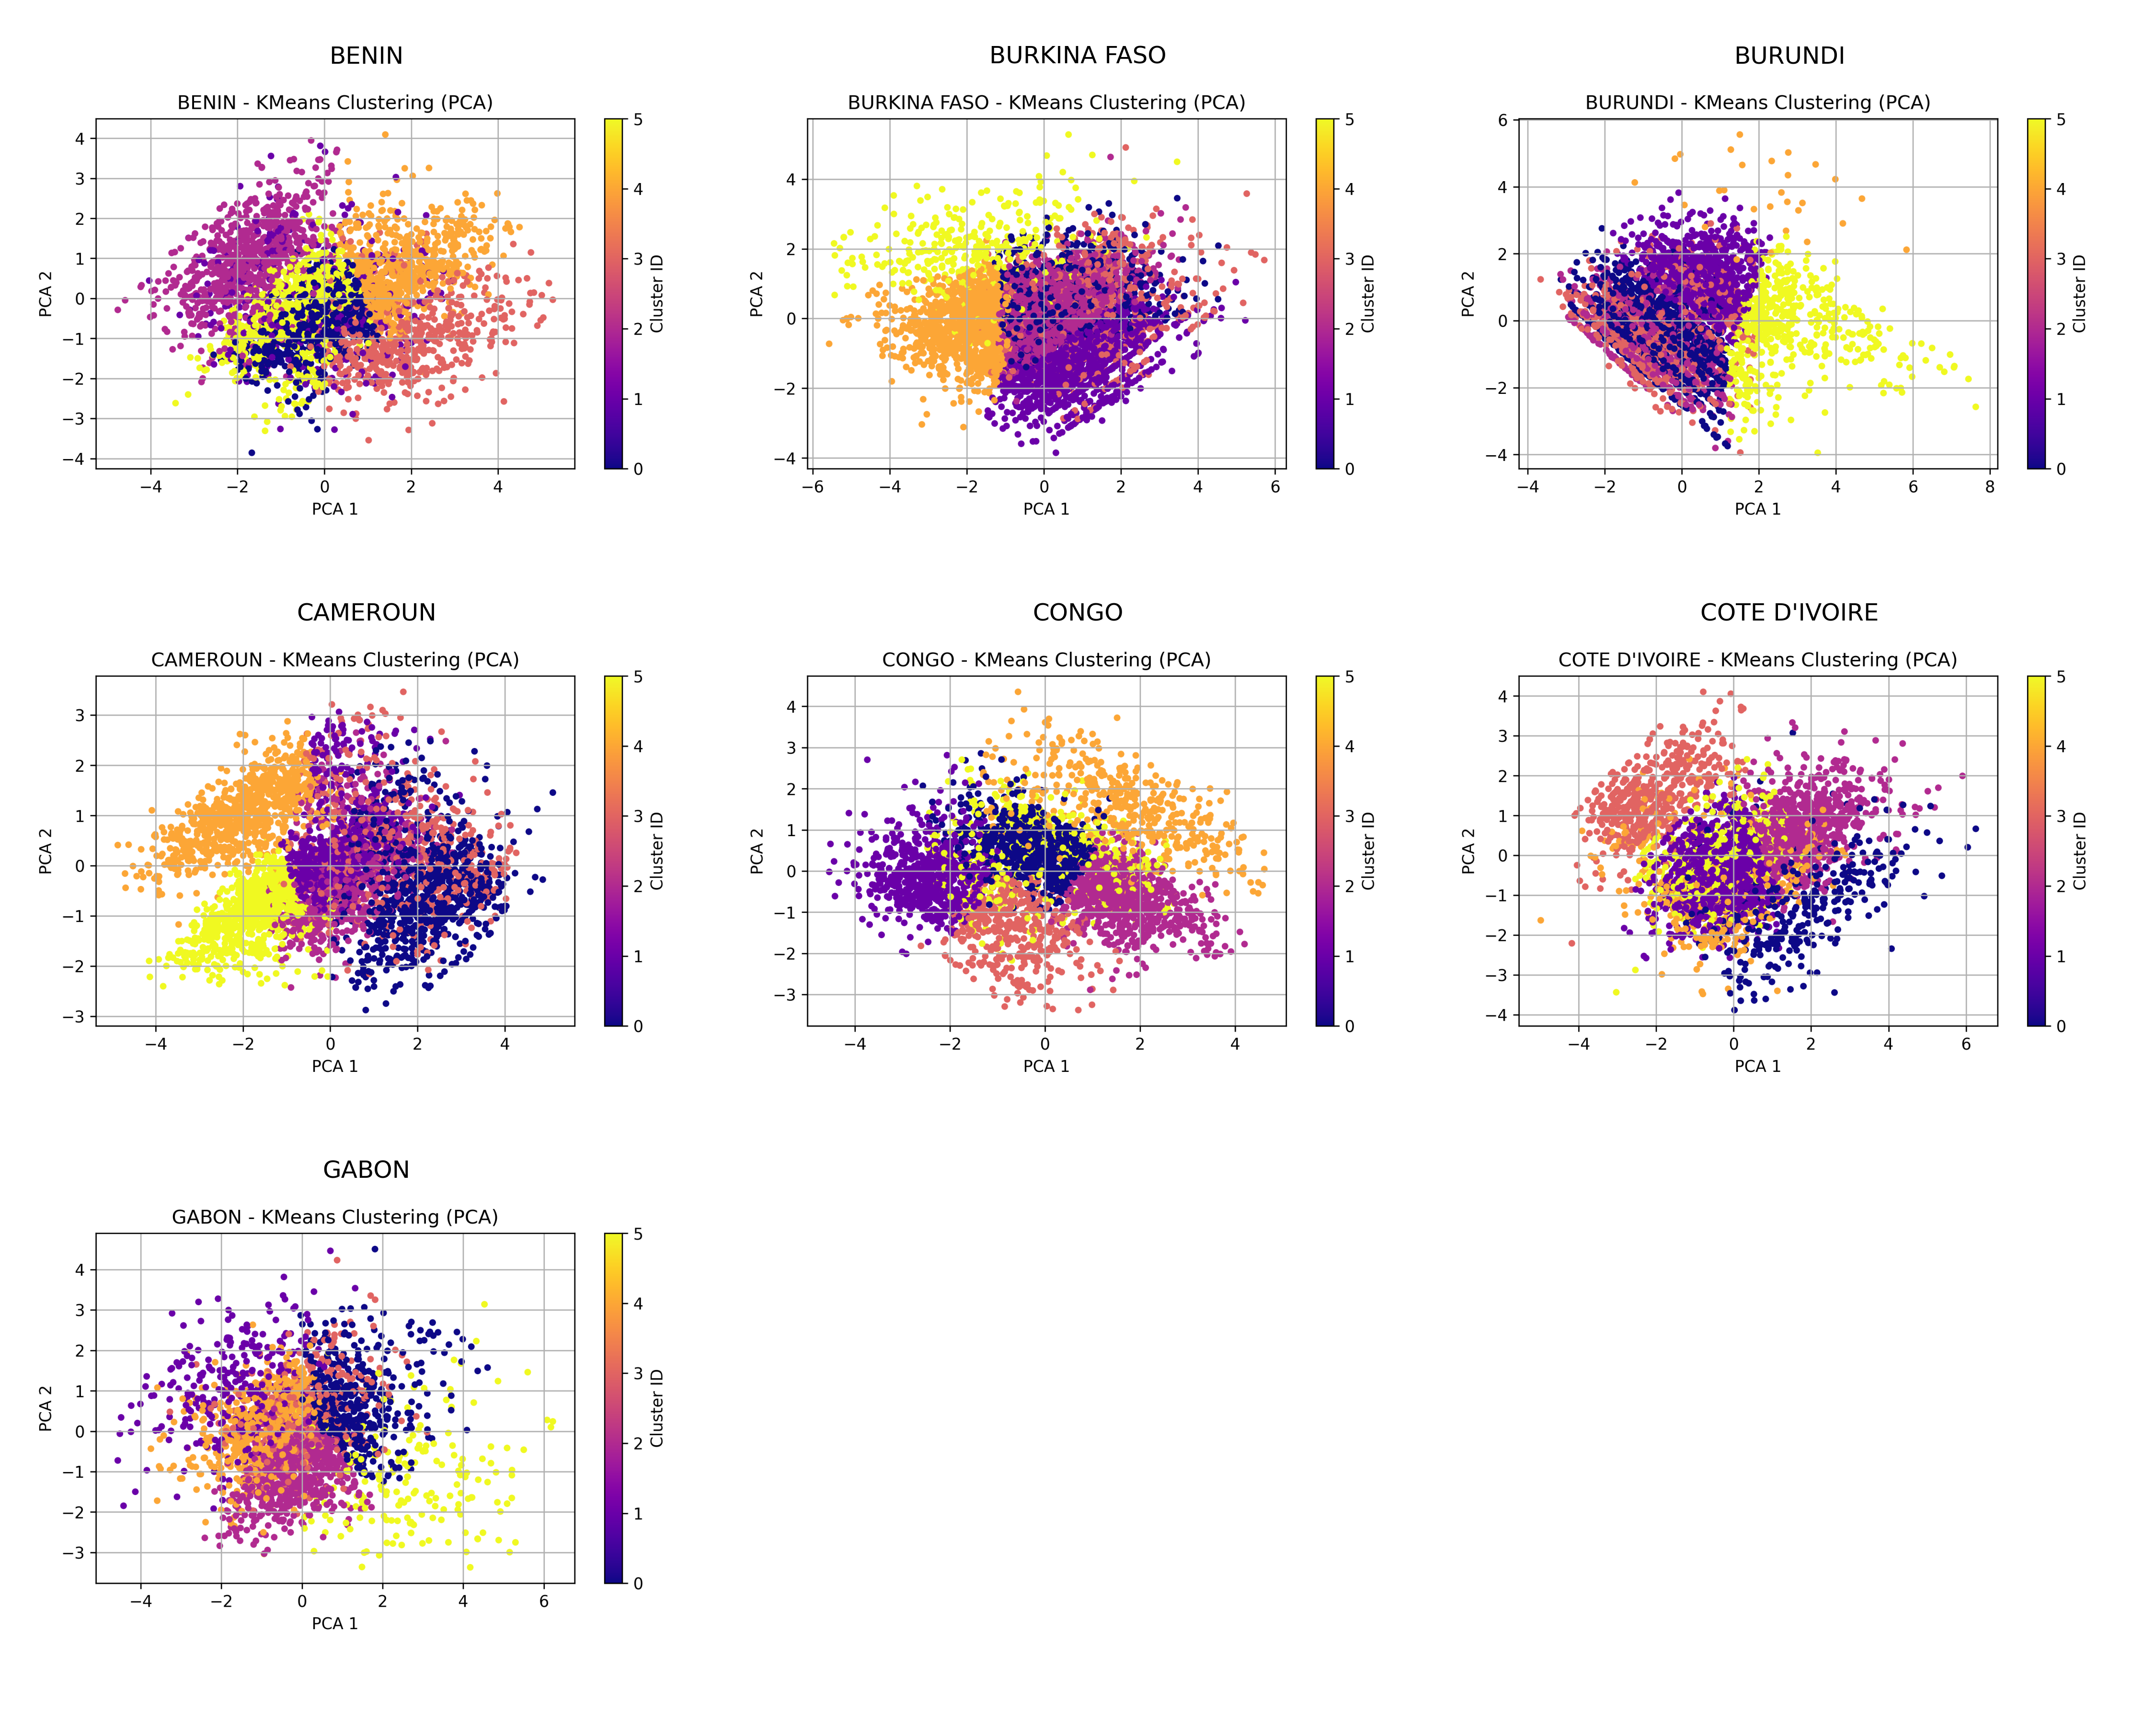
PCA Projection with Clusters – Part 1
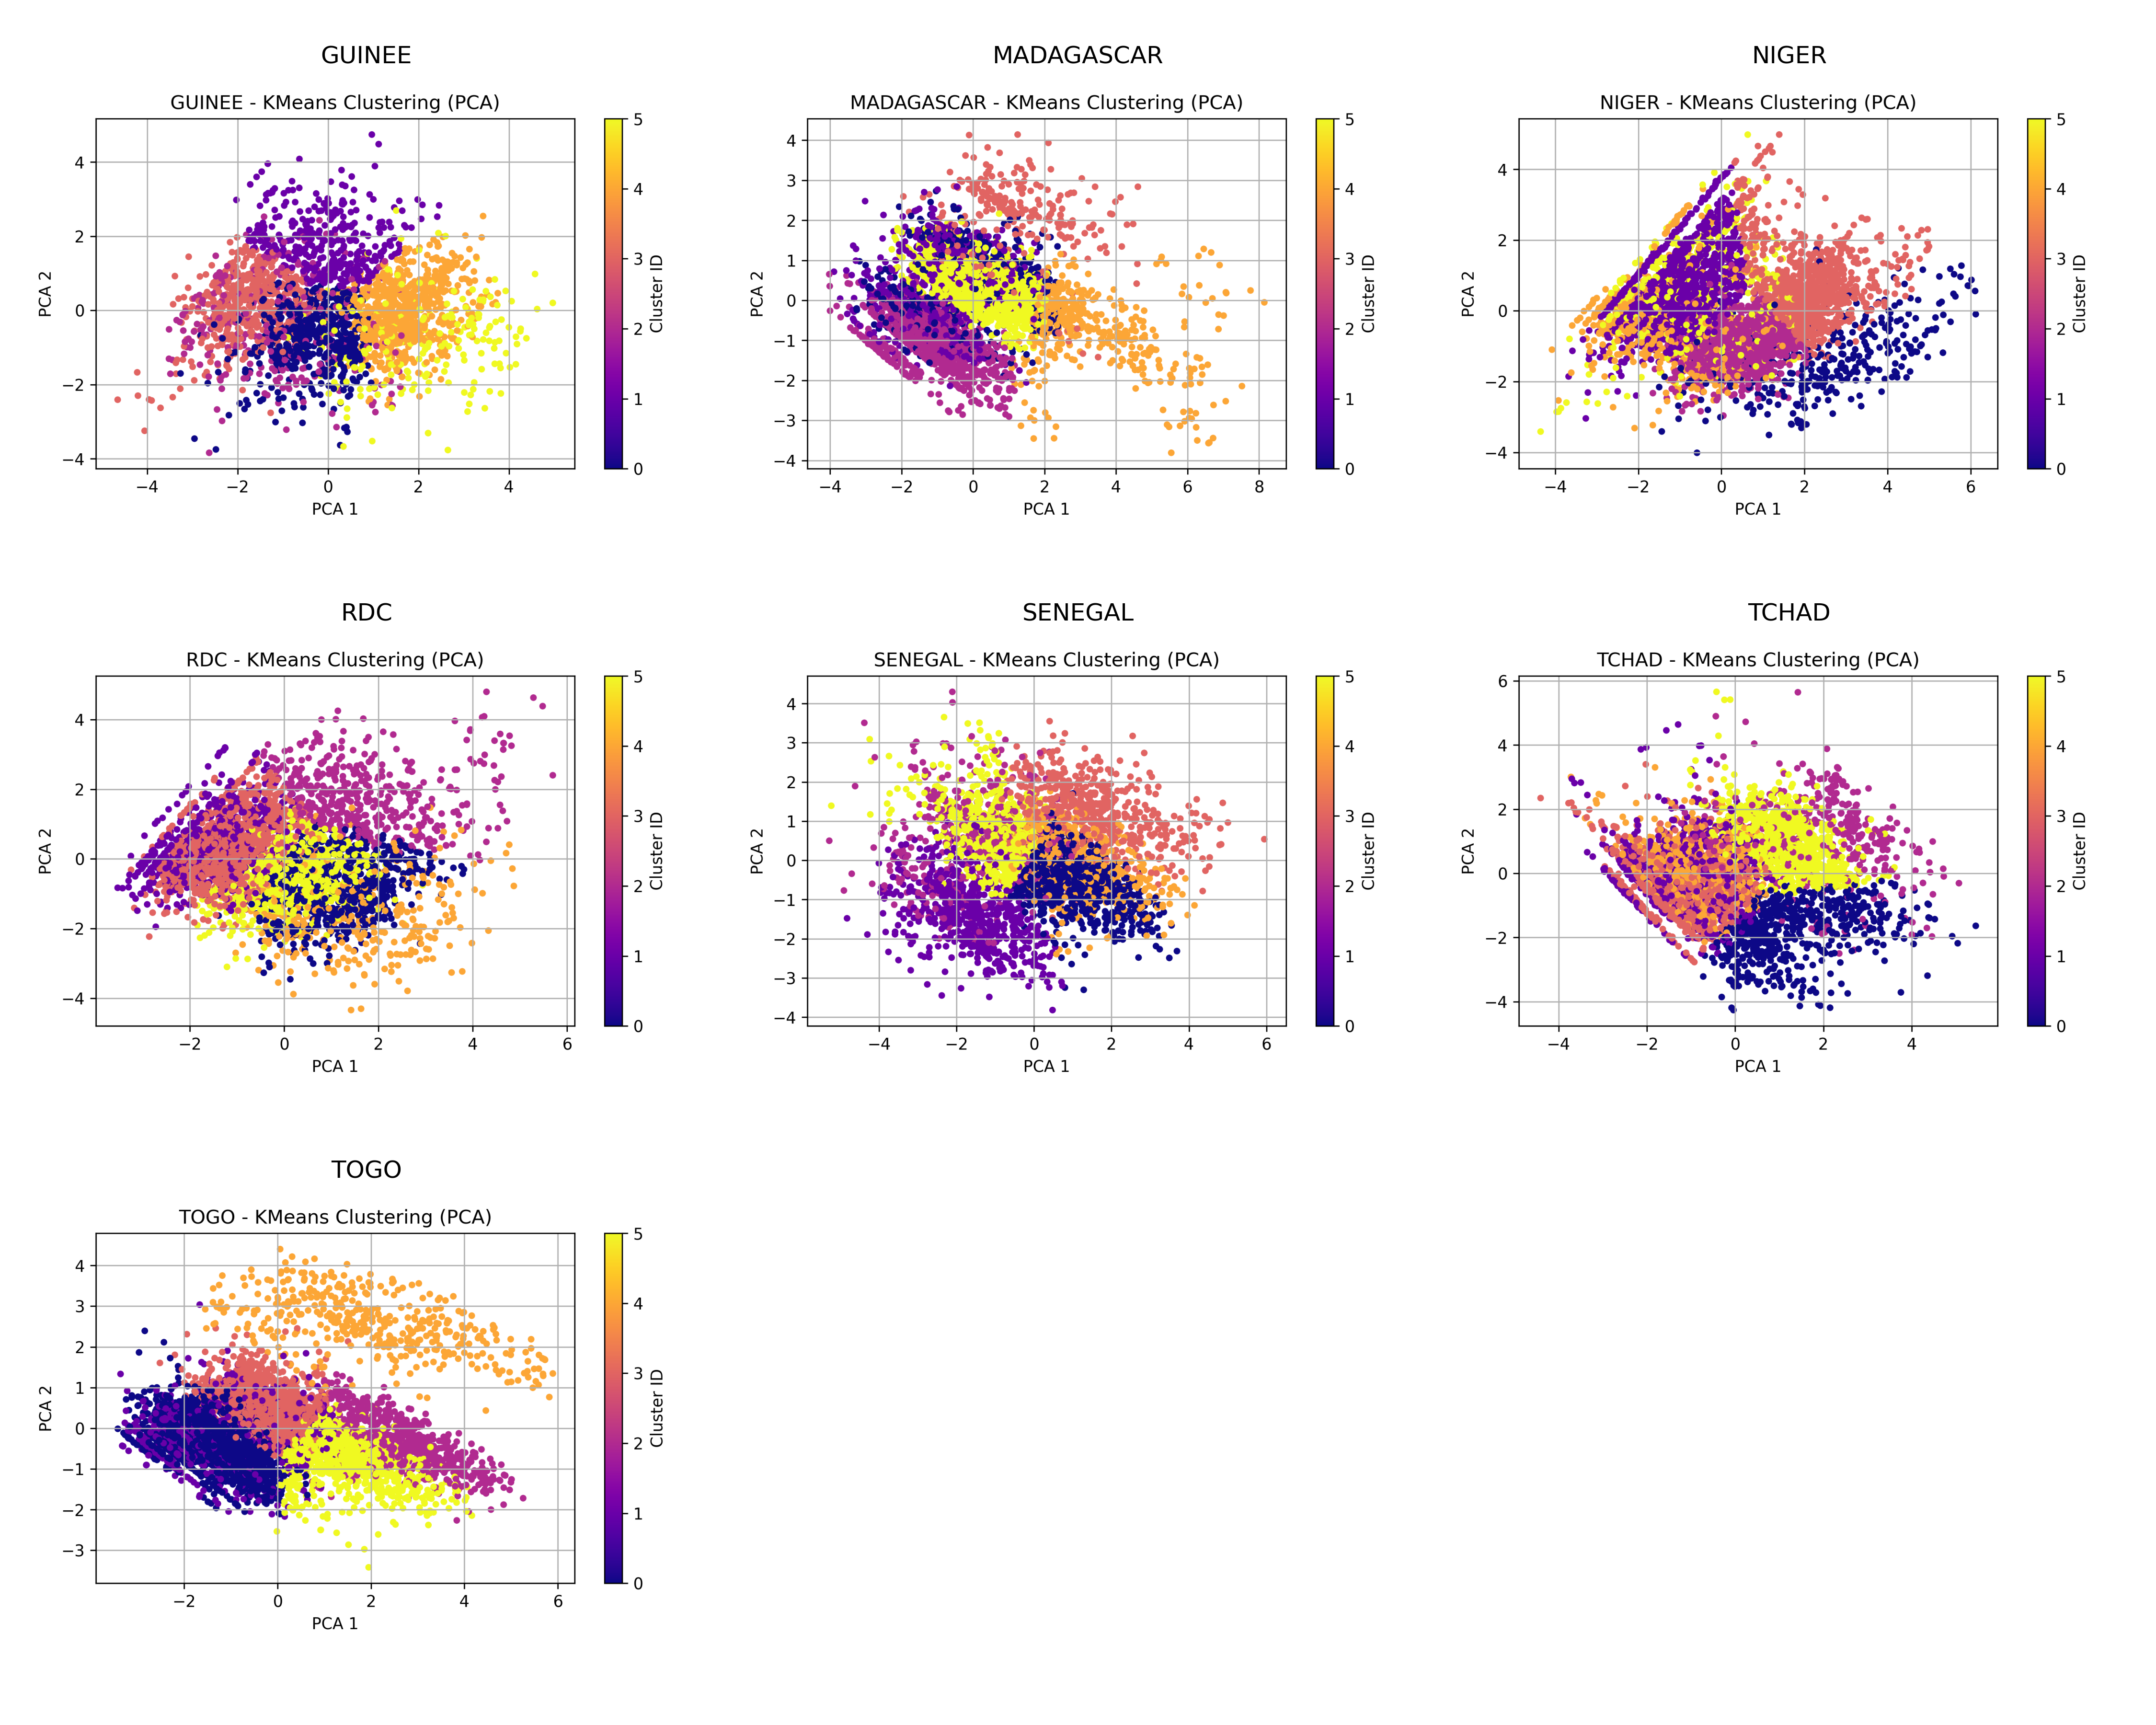
PCA Projection with Clusters – Part 2
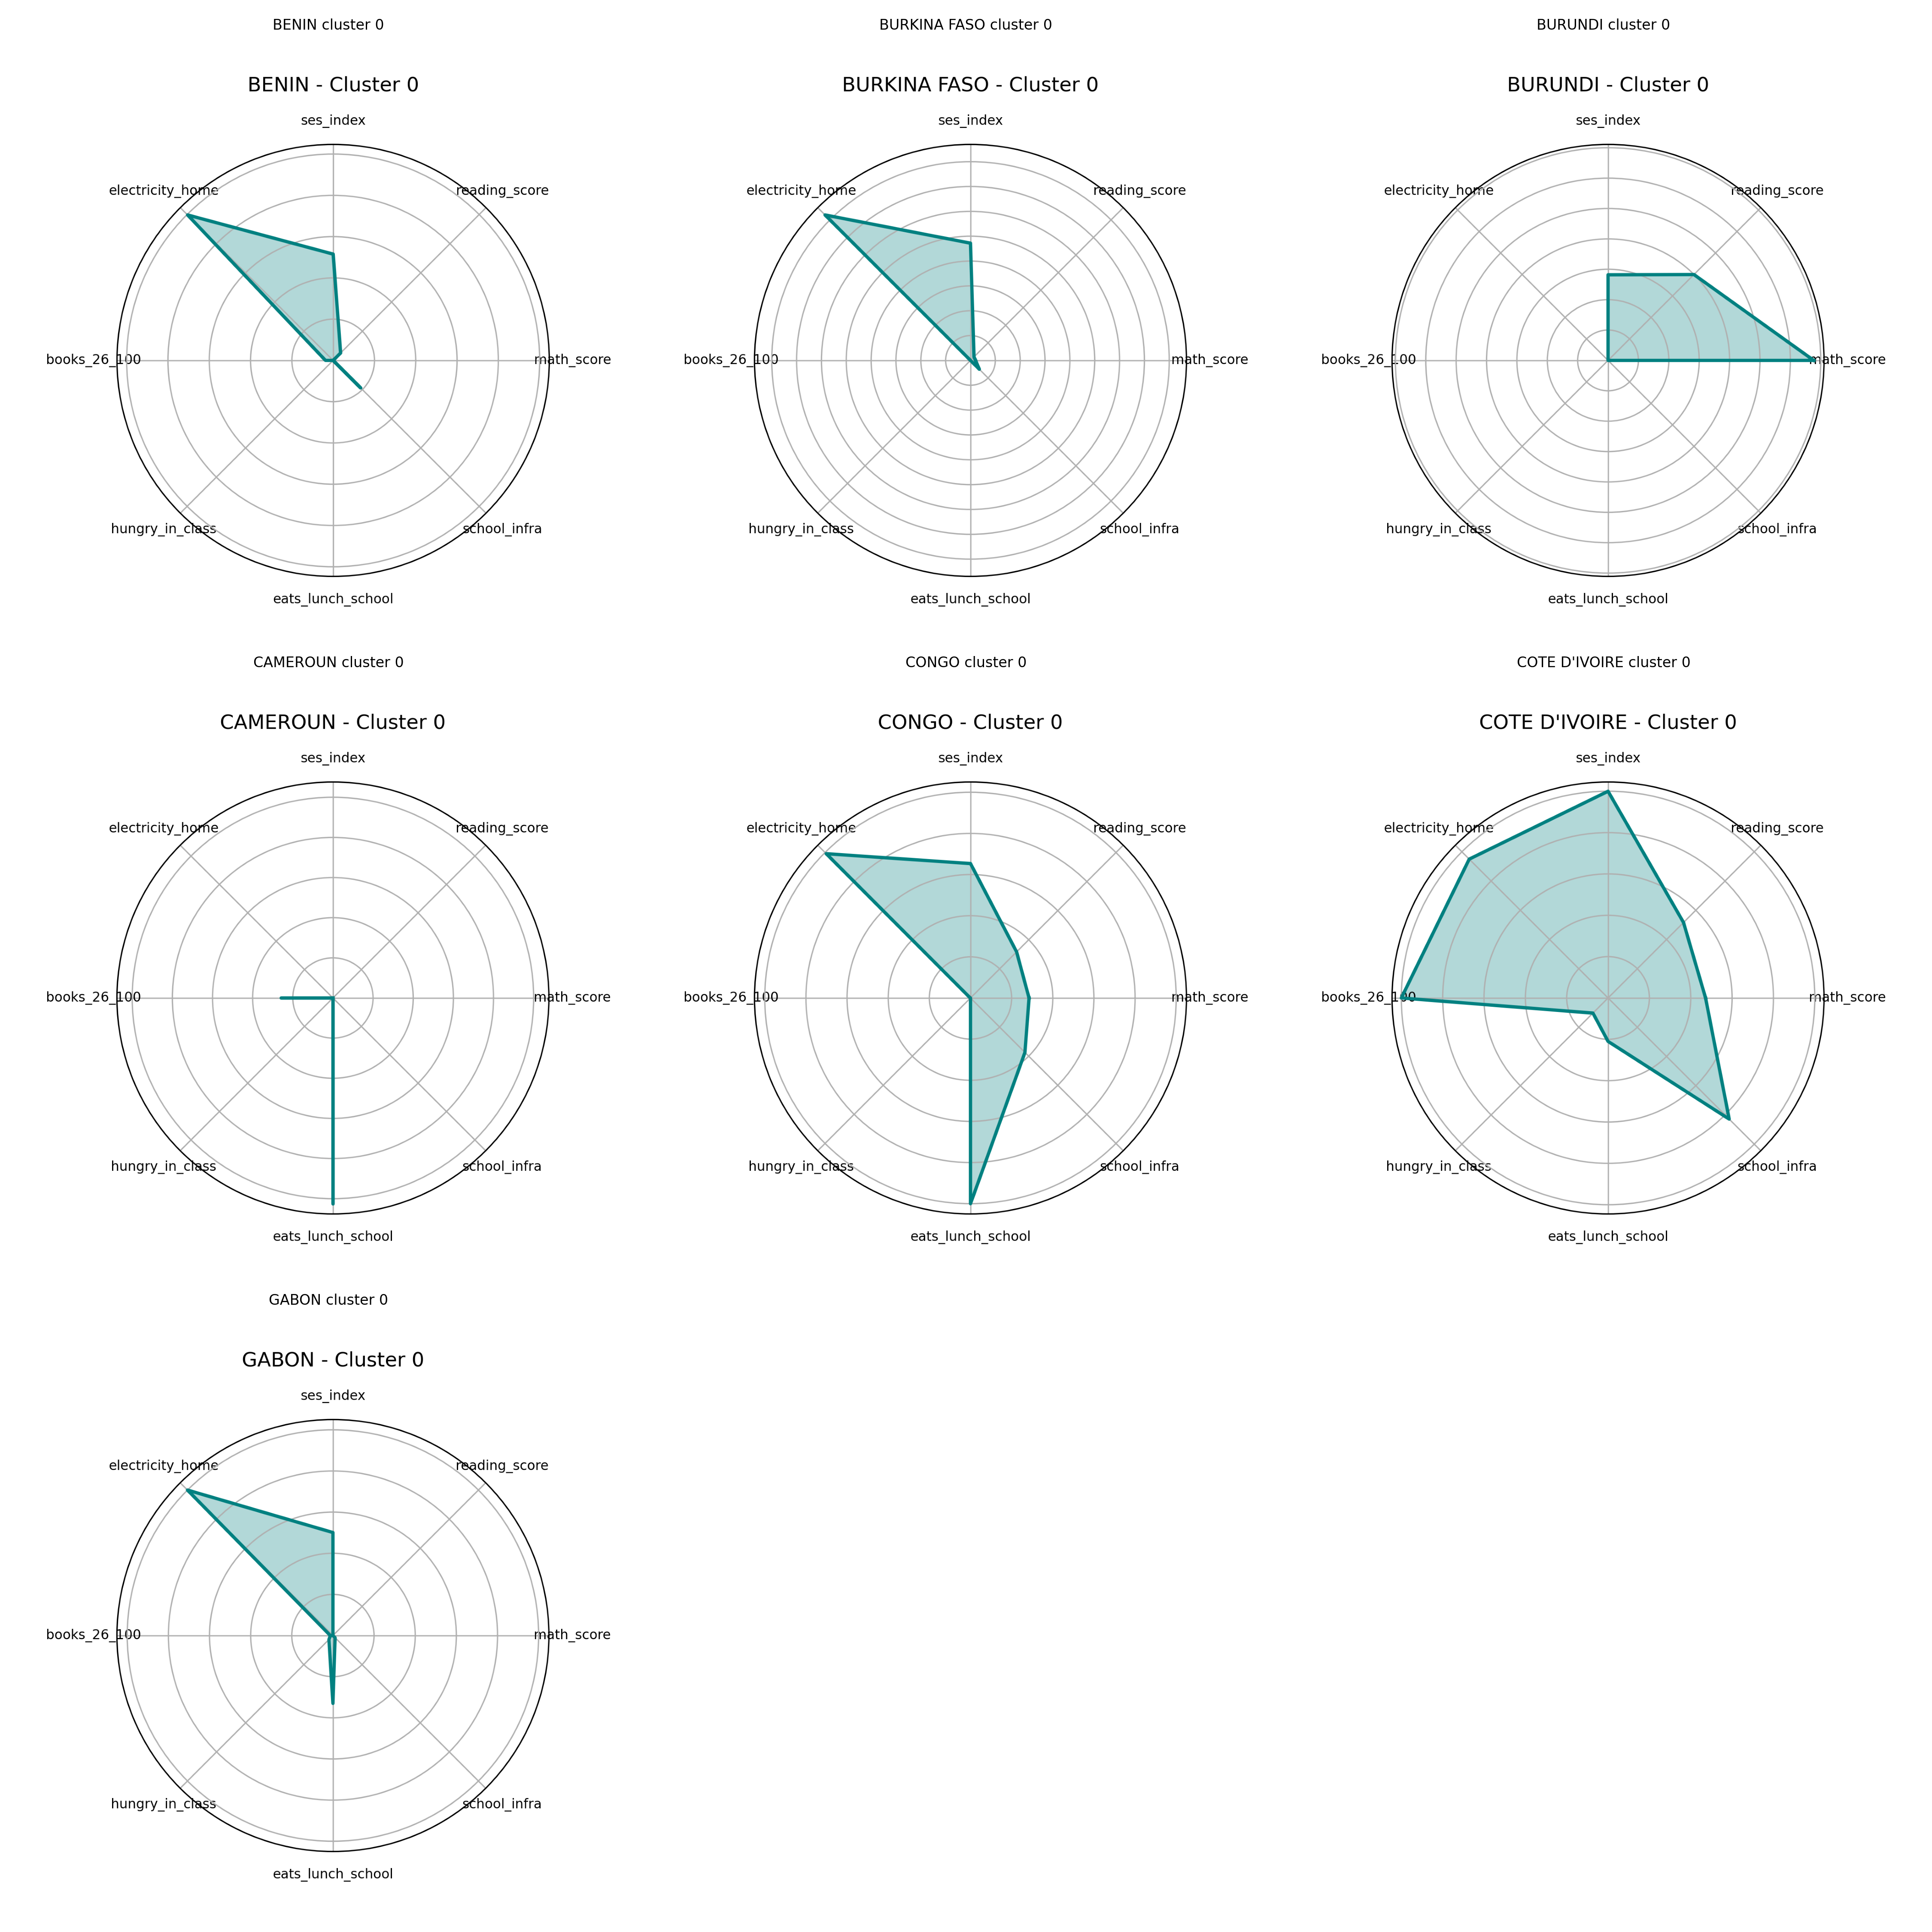
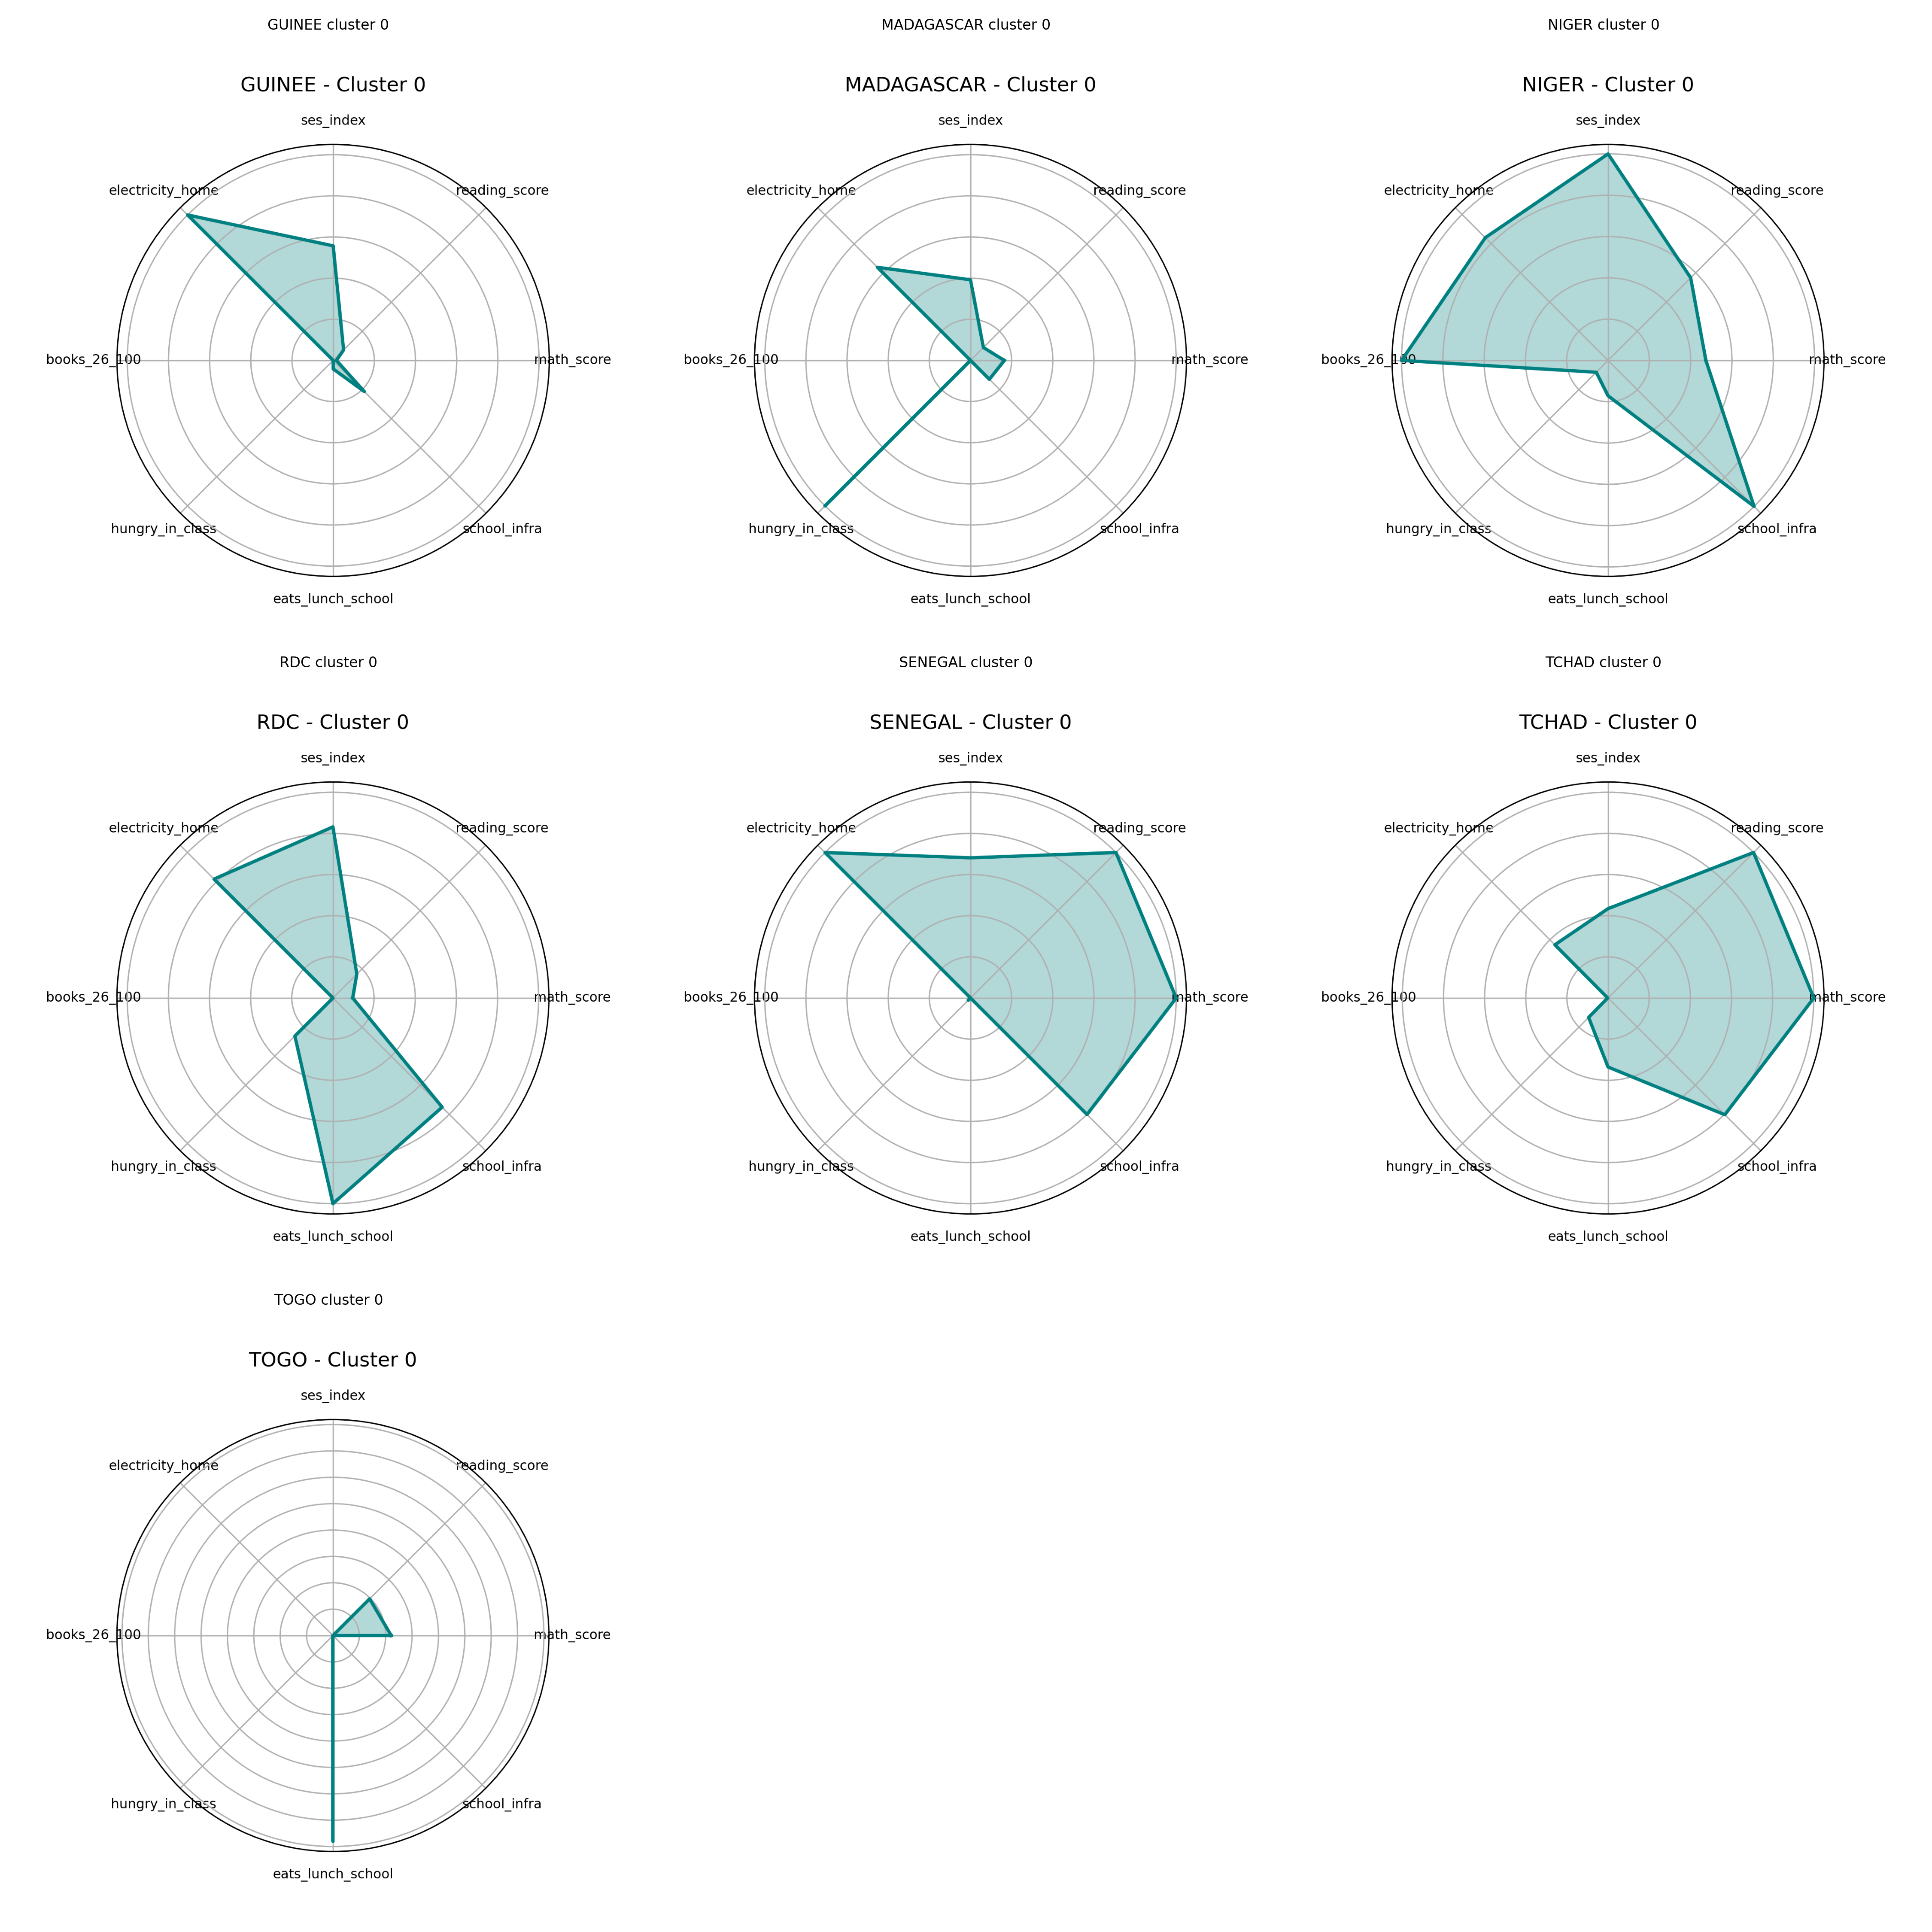
Radar Charts – Cluster 0
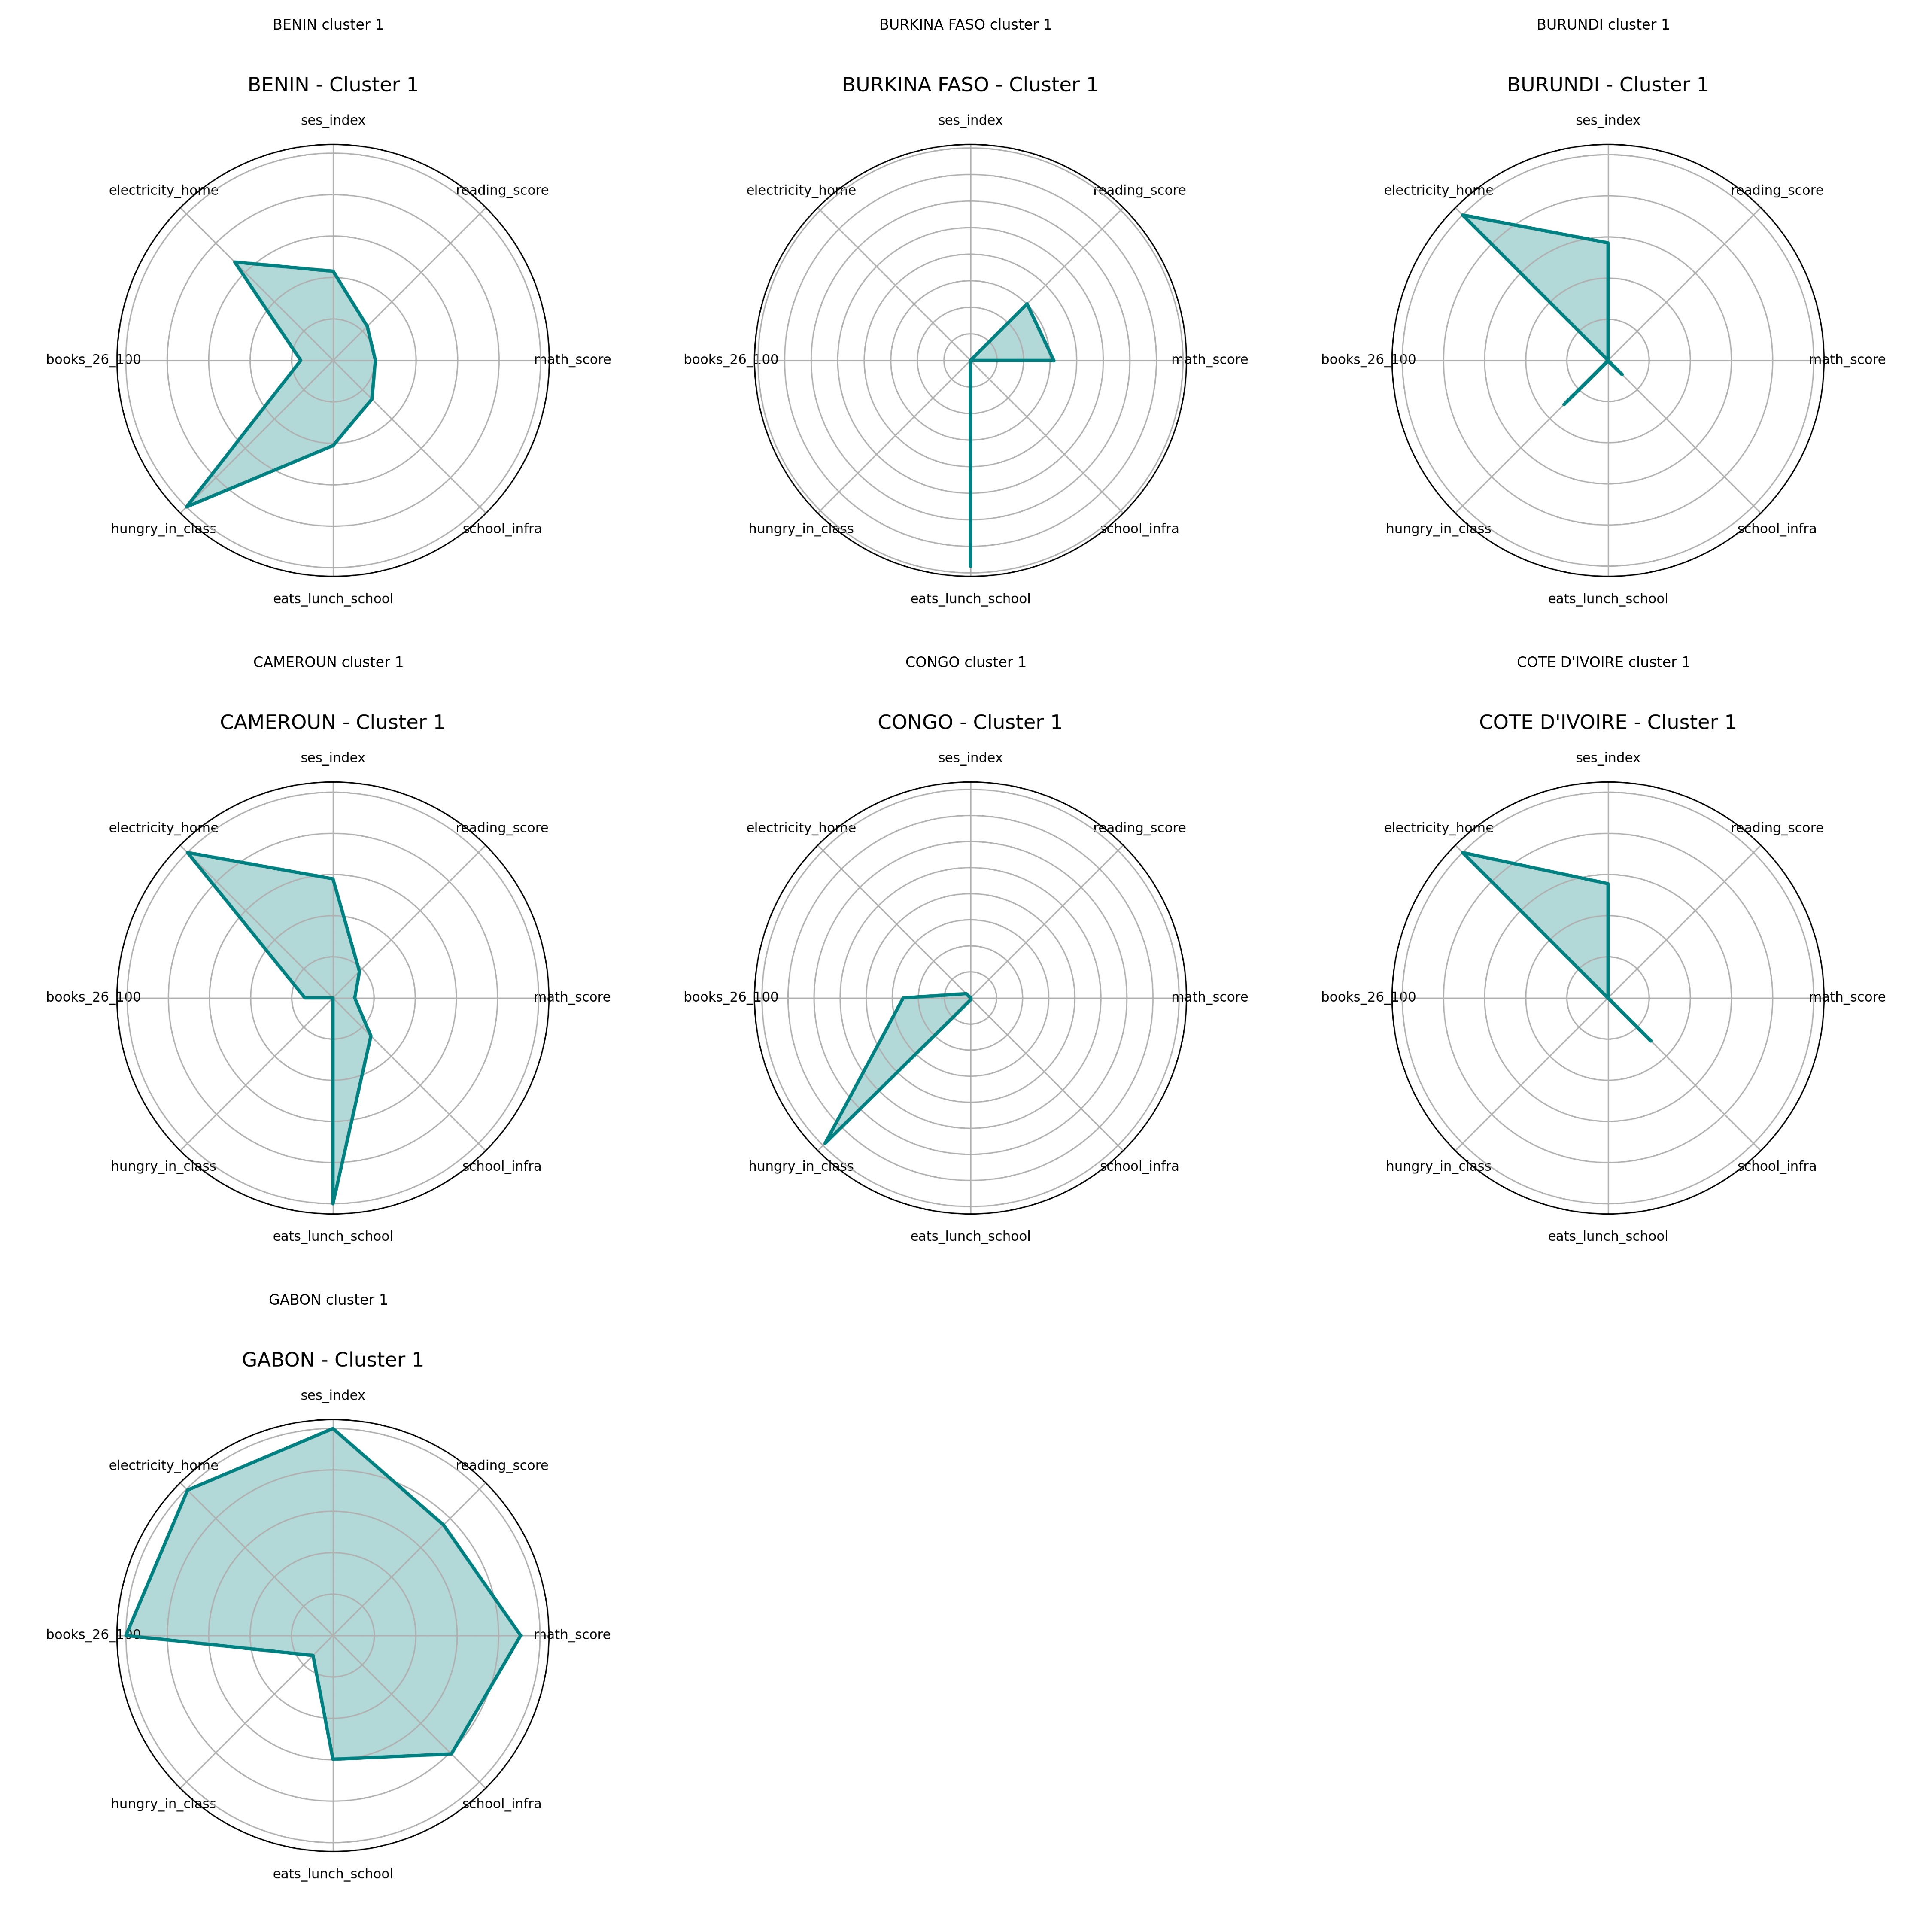
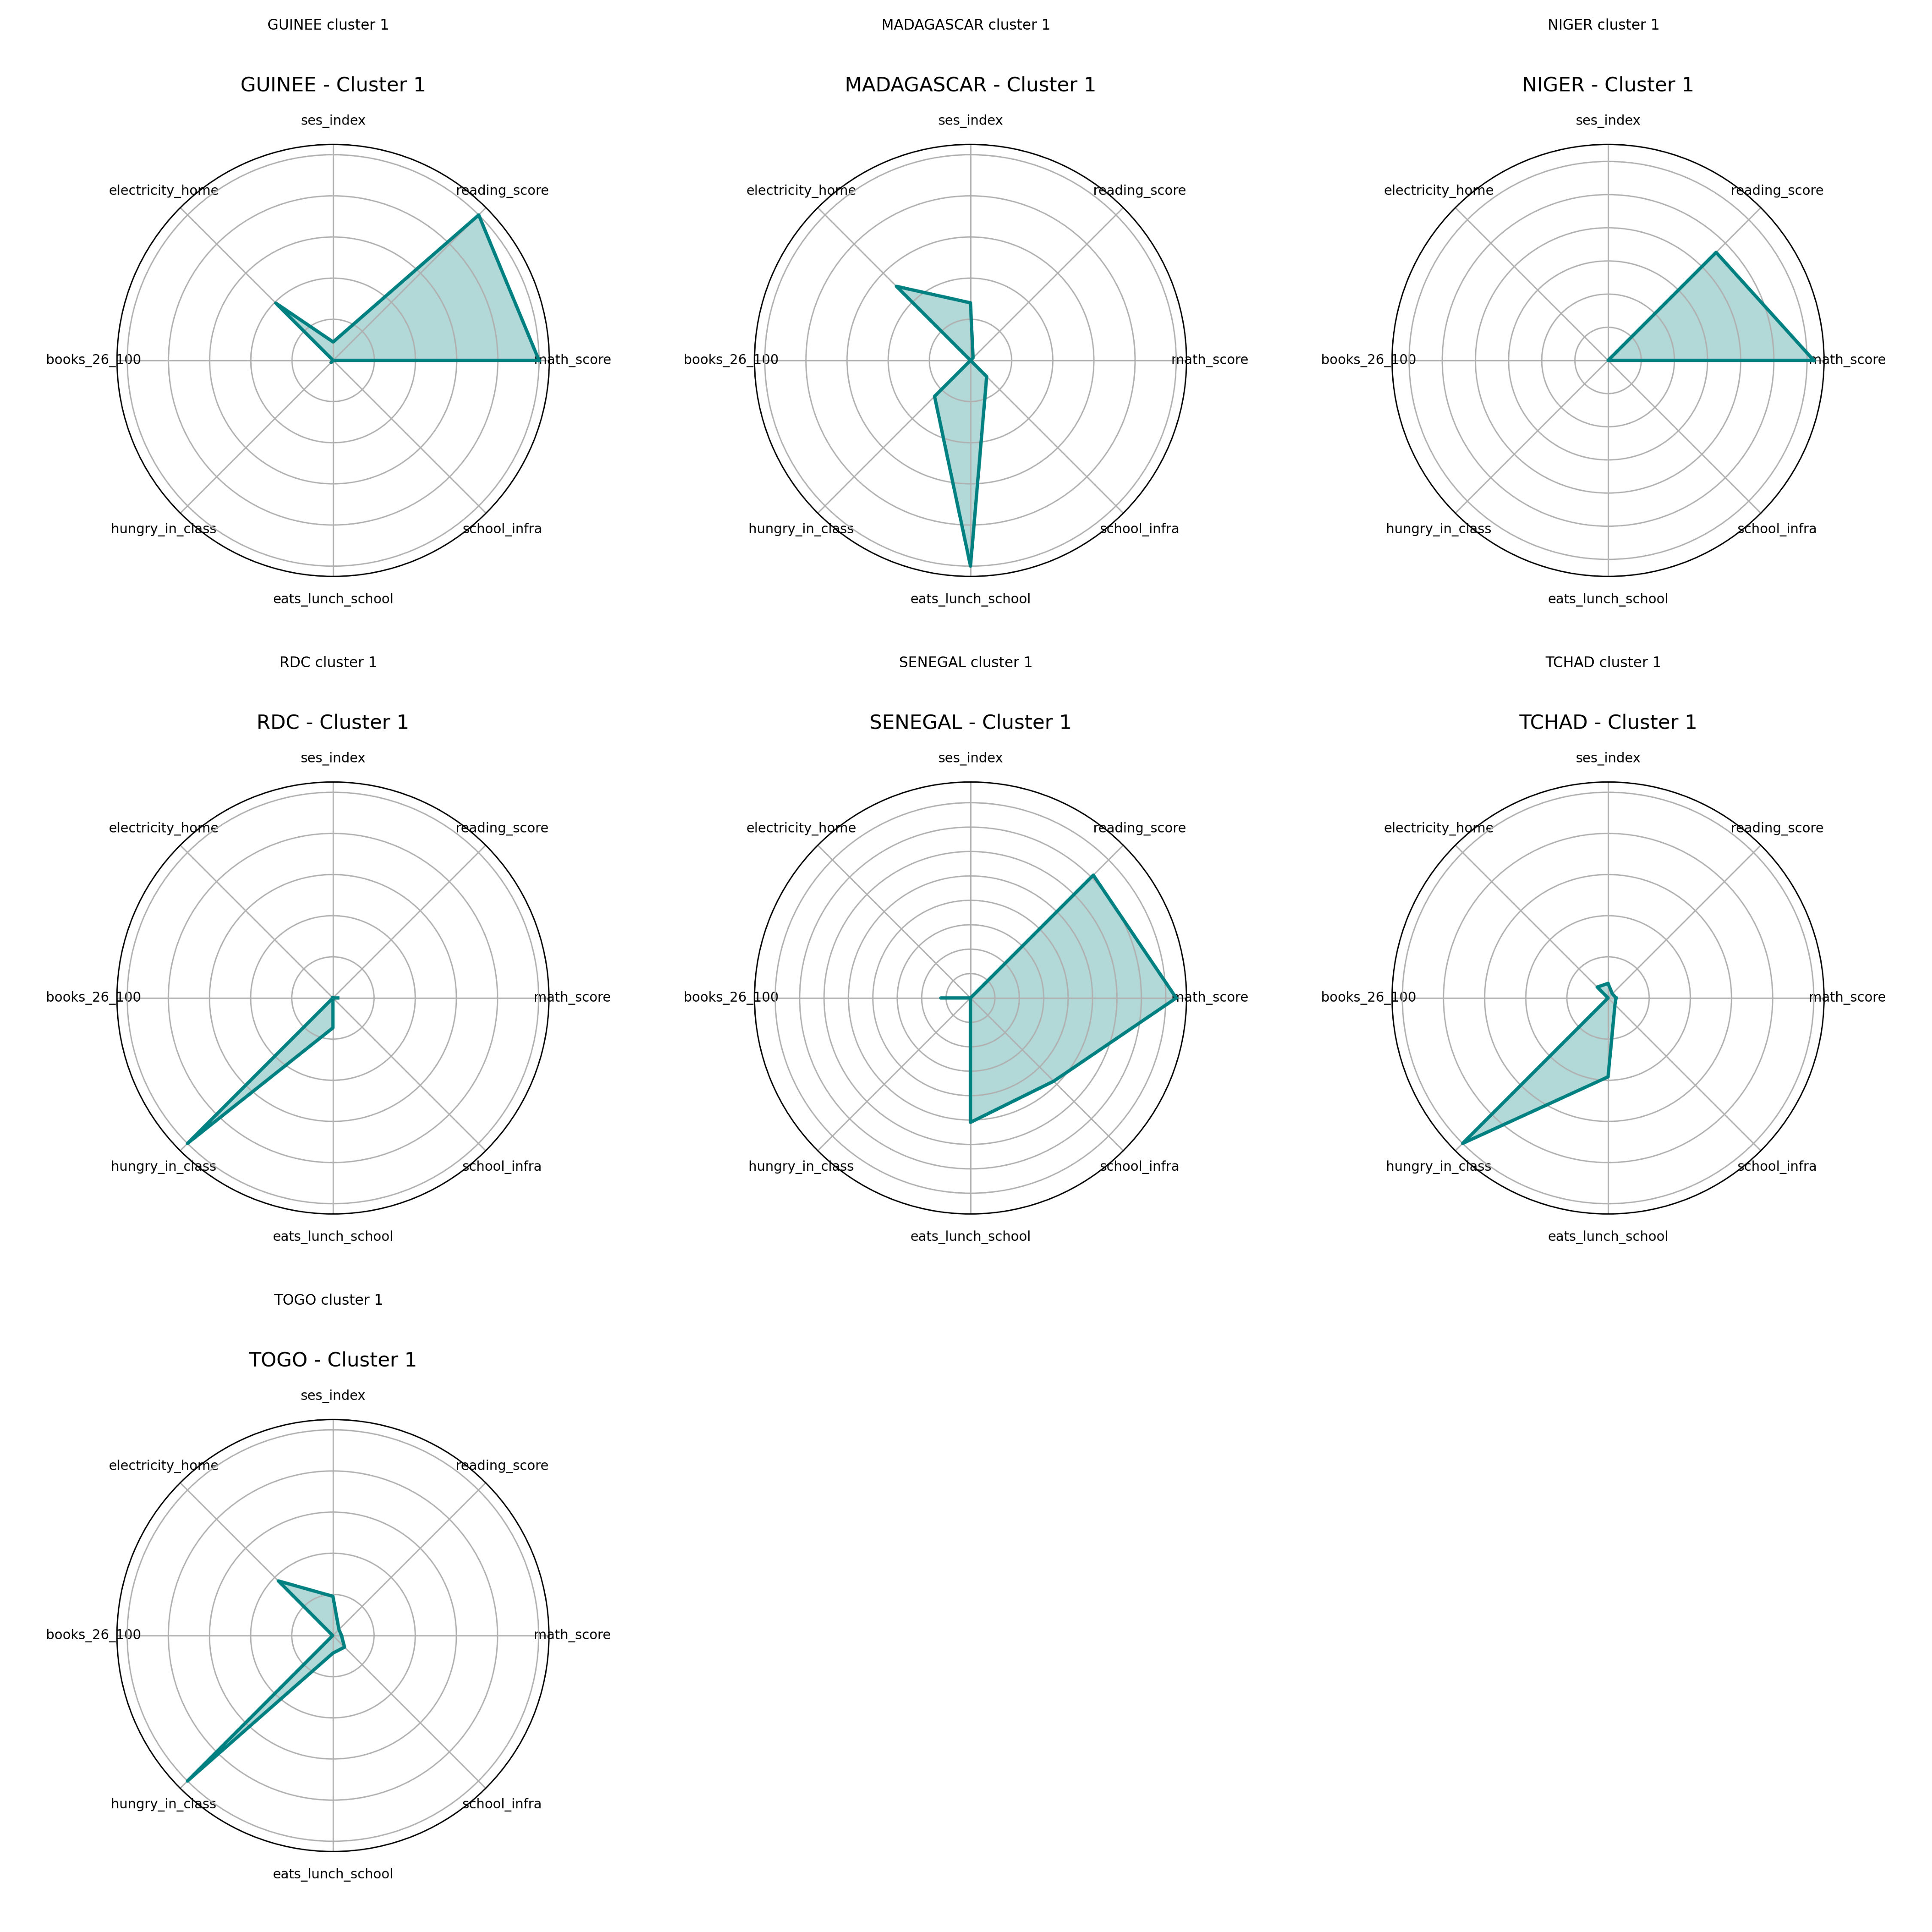
Radar Charts – Cluster 1
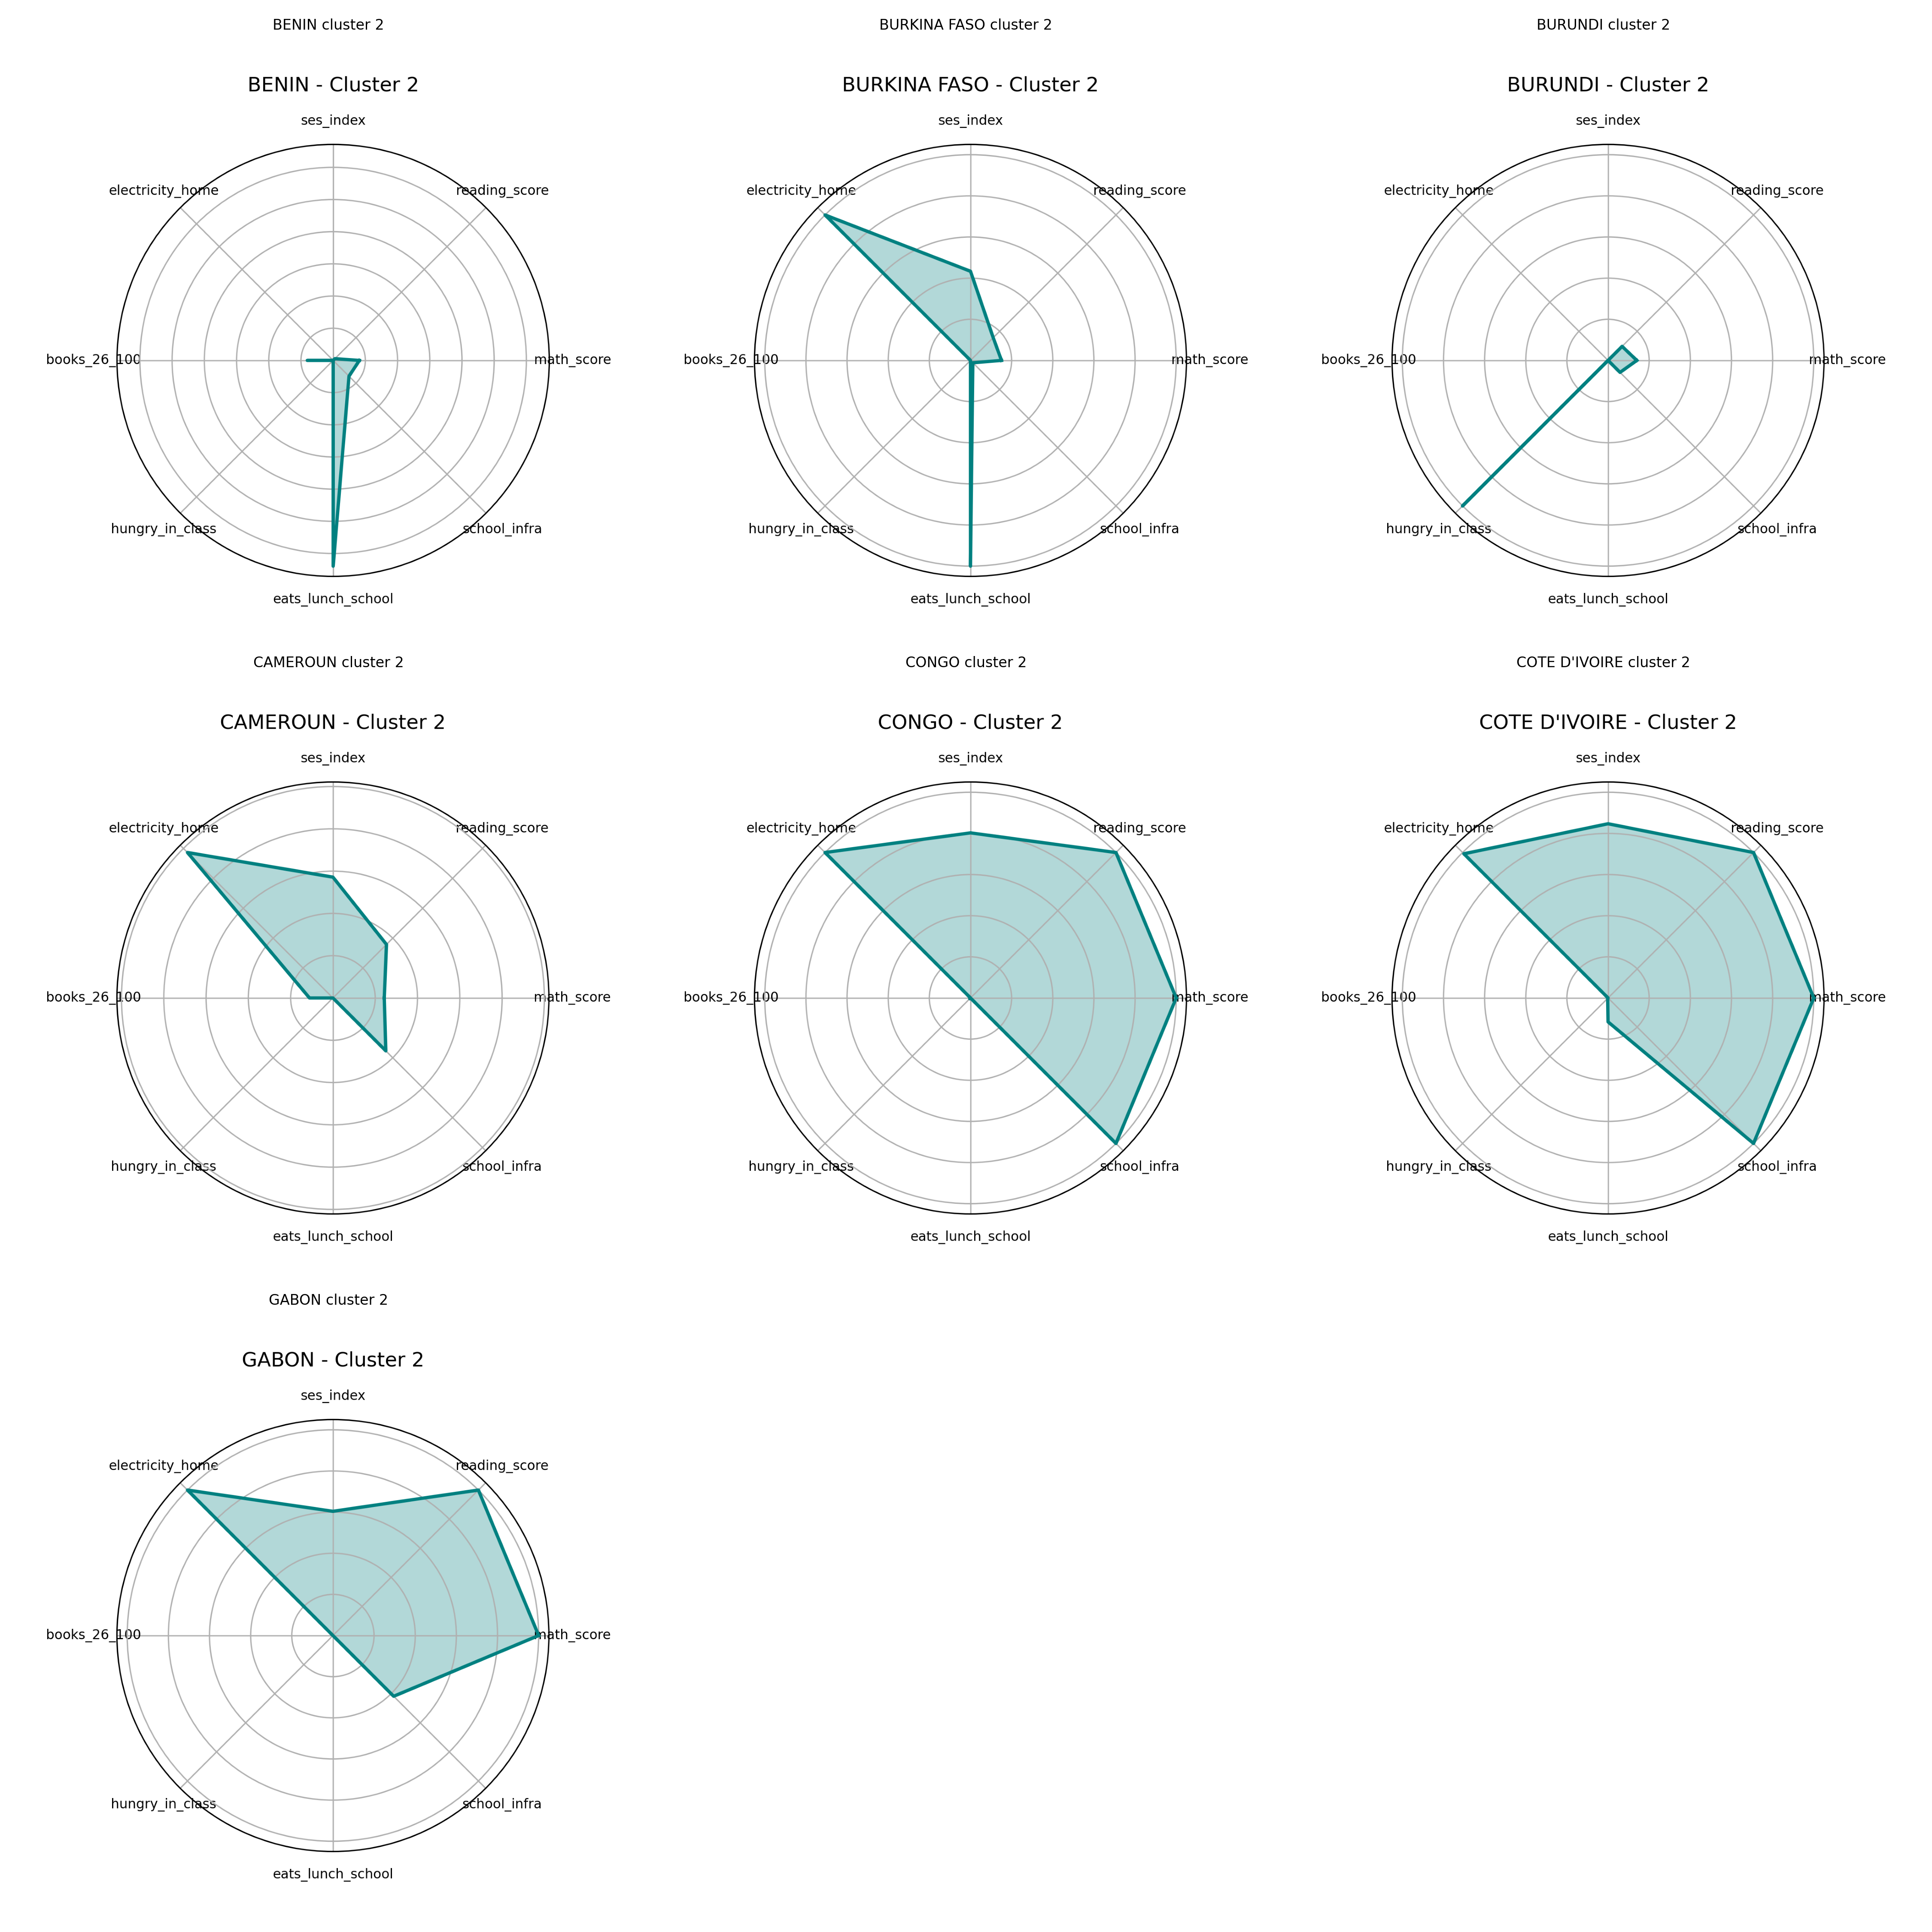
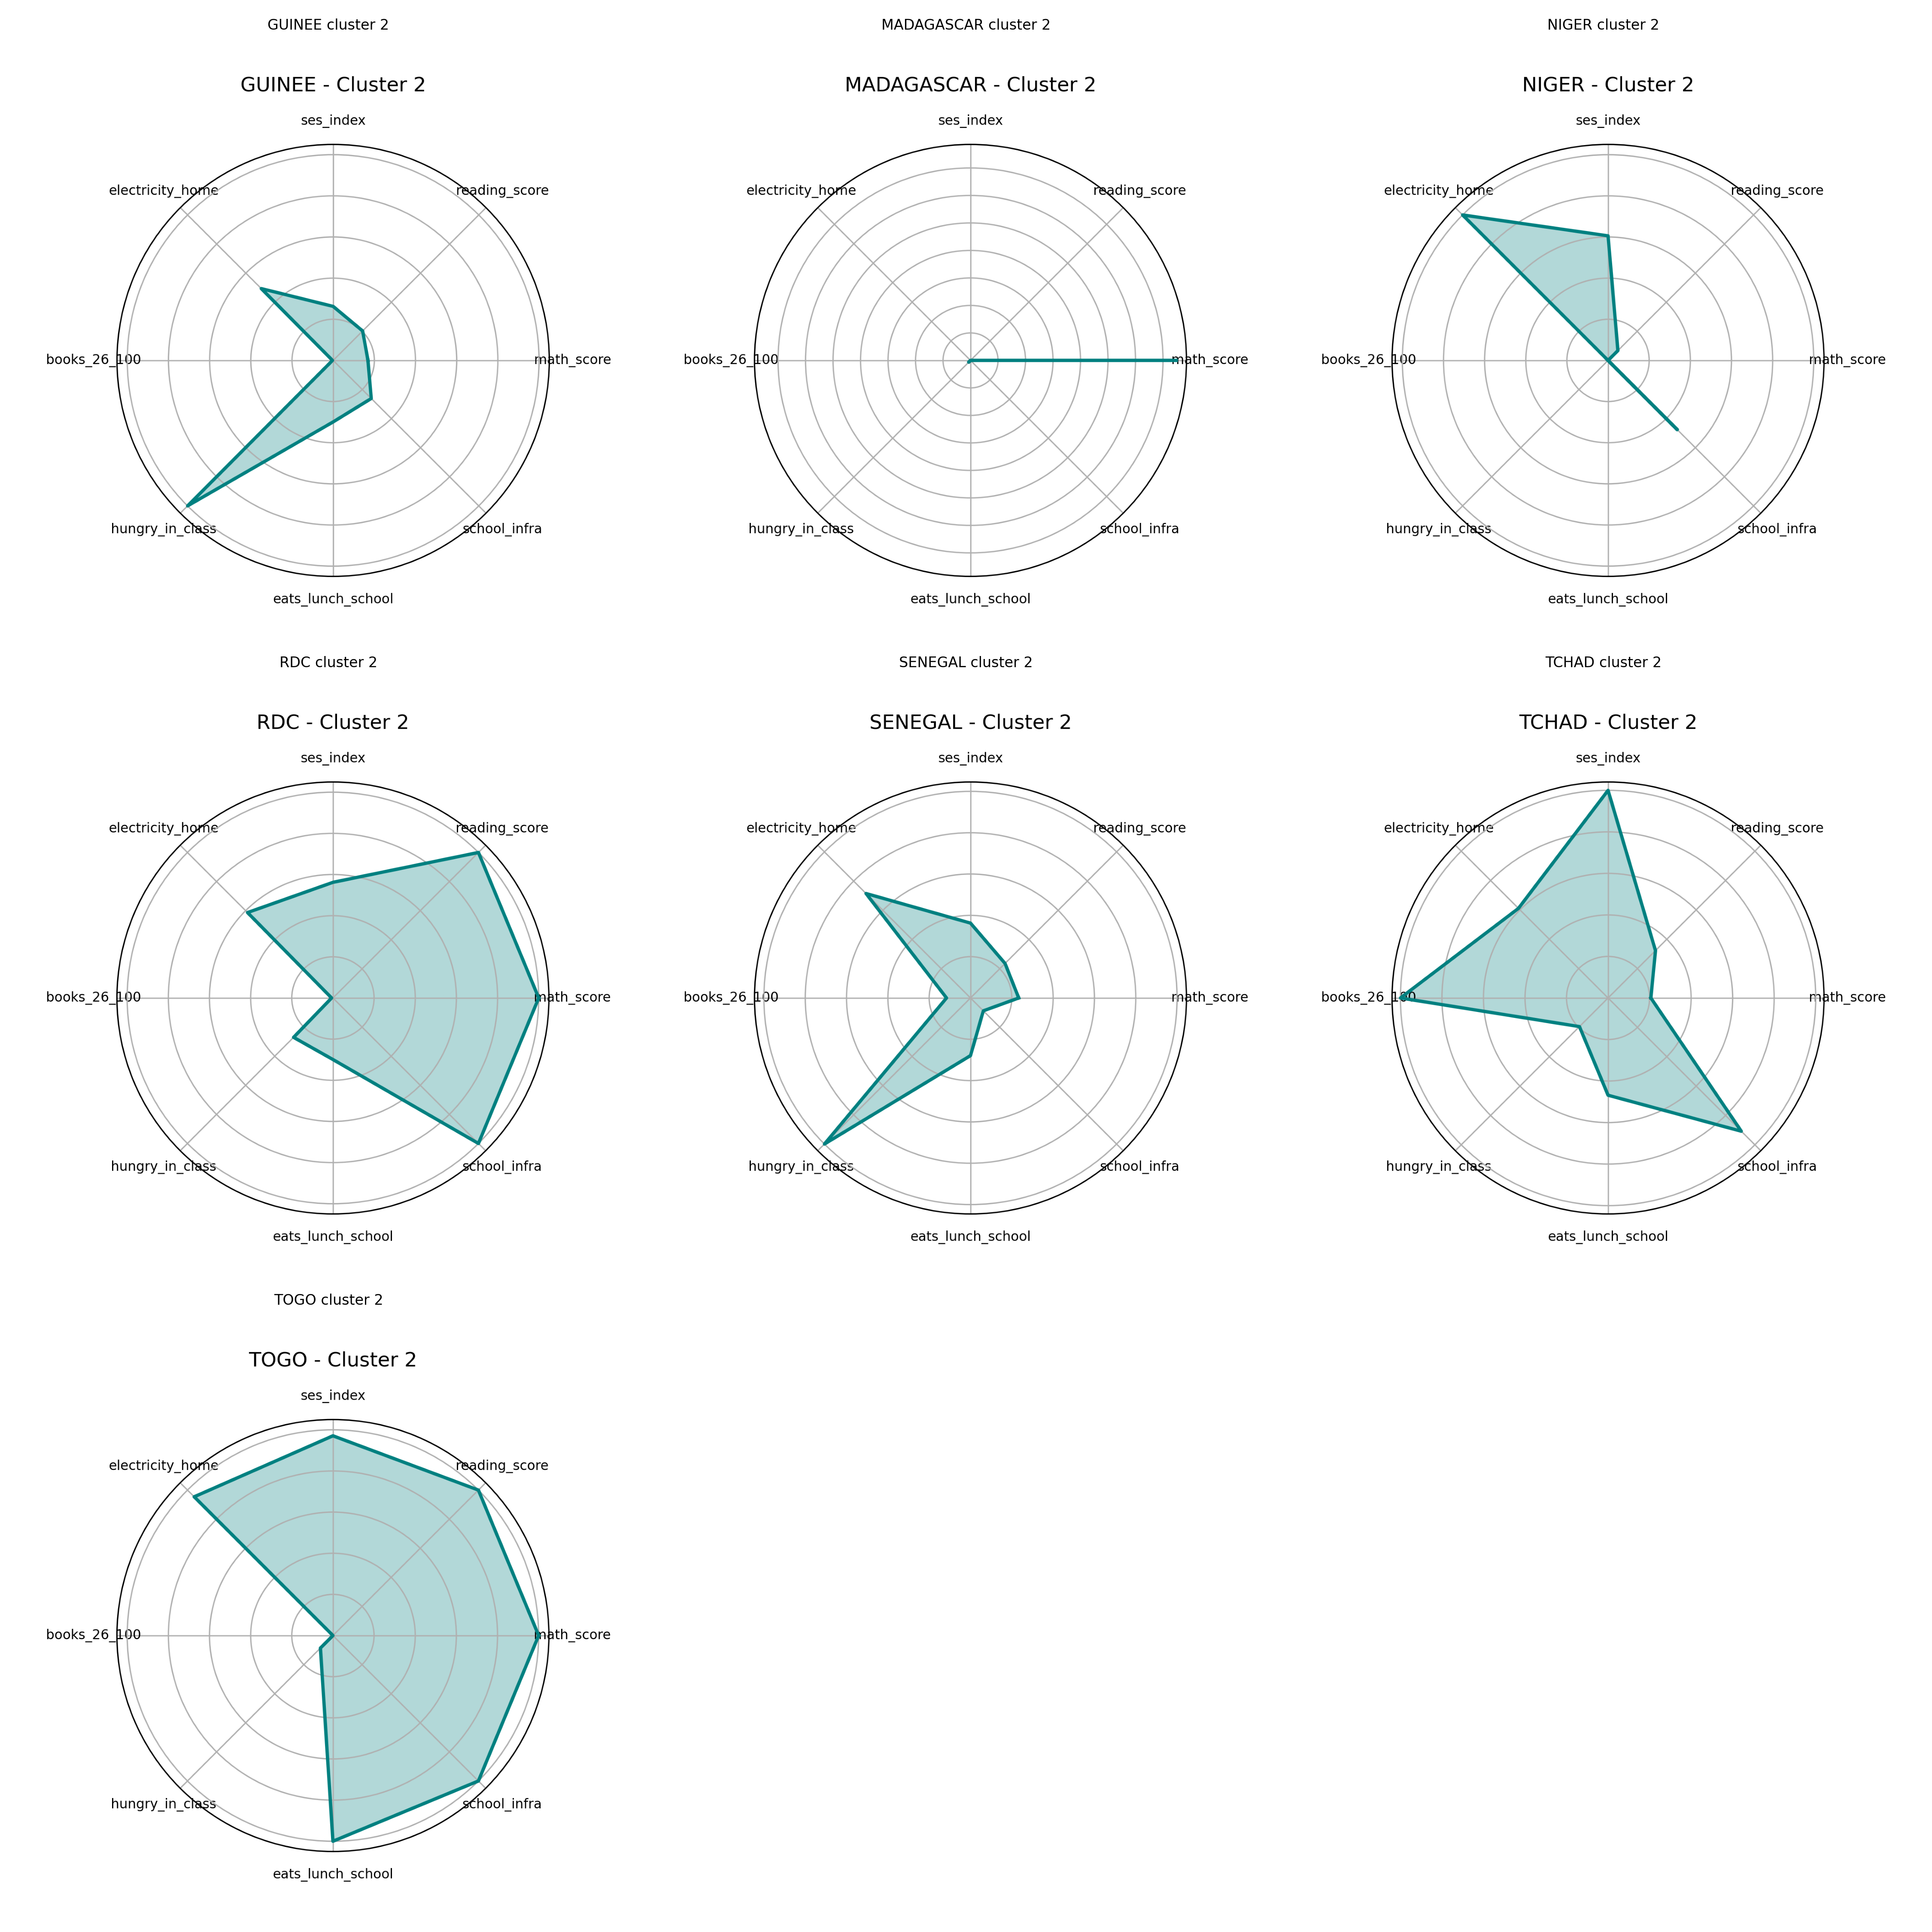
Radar Charts – Cluster 2
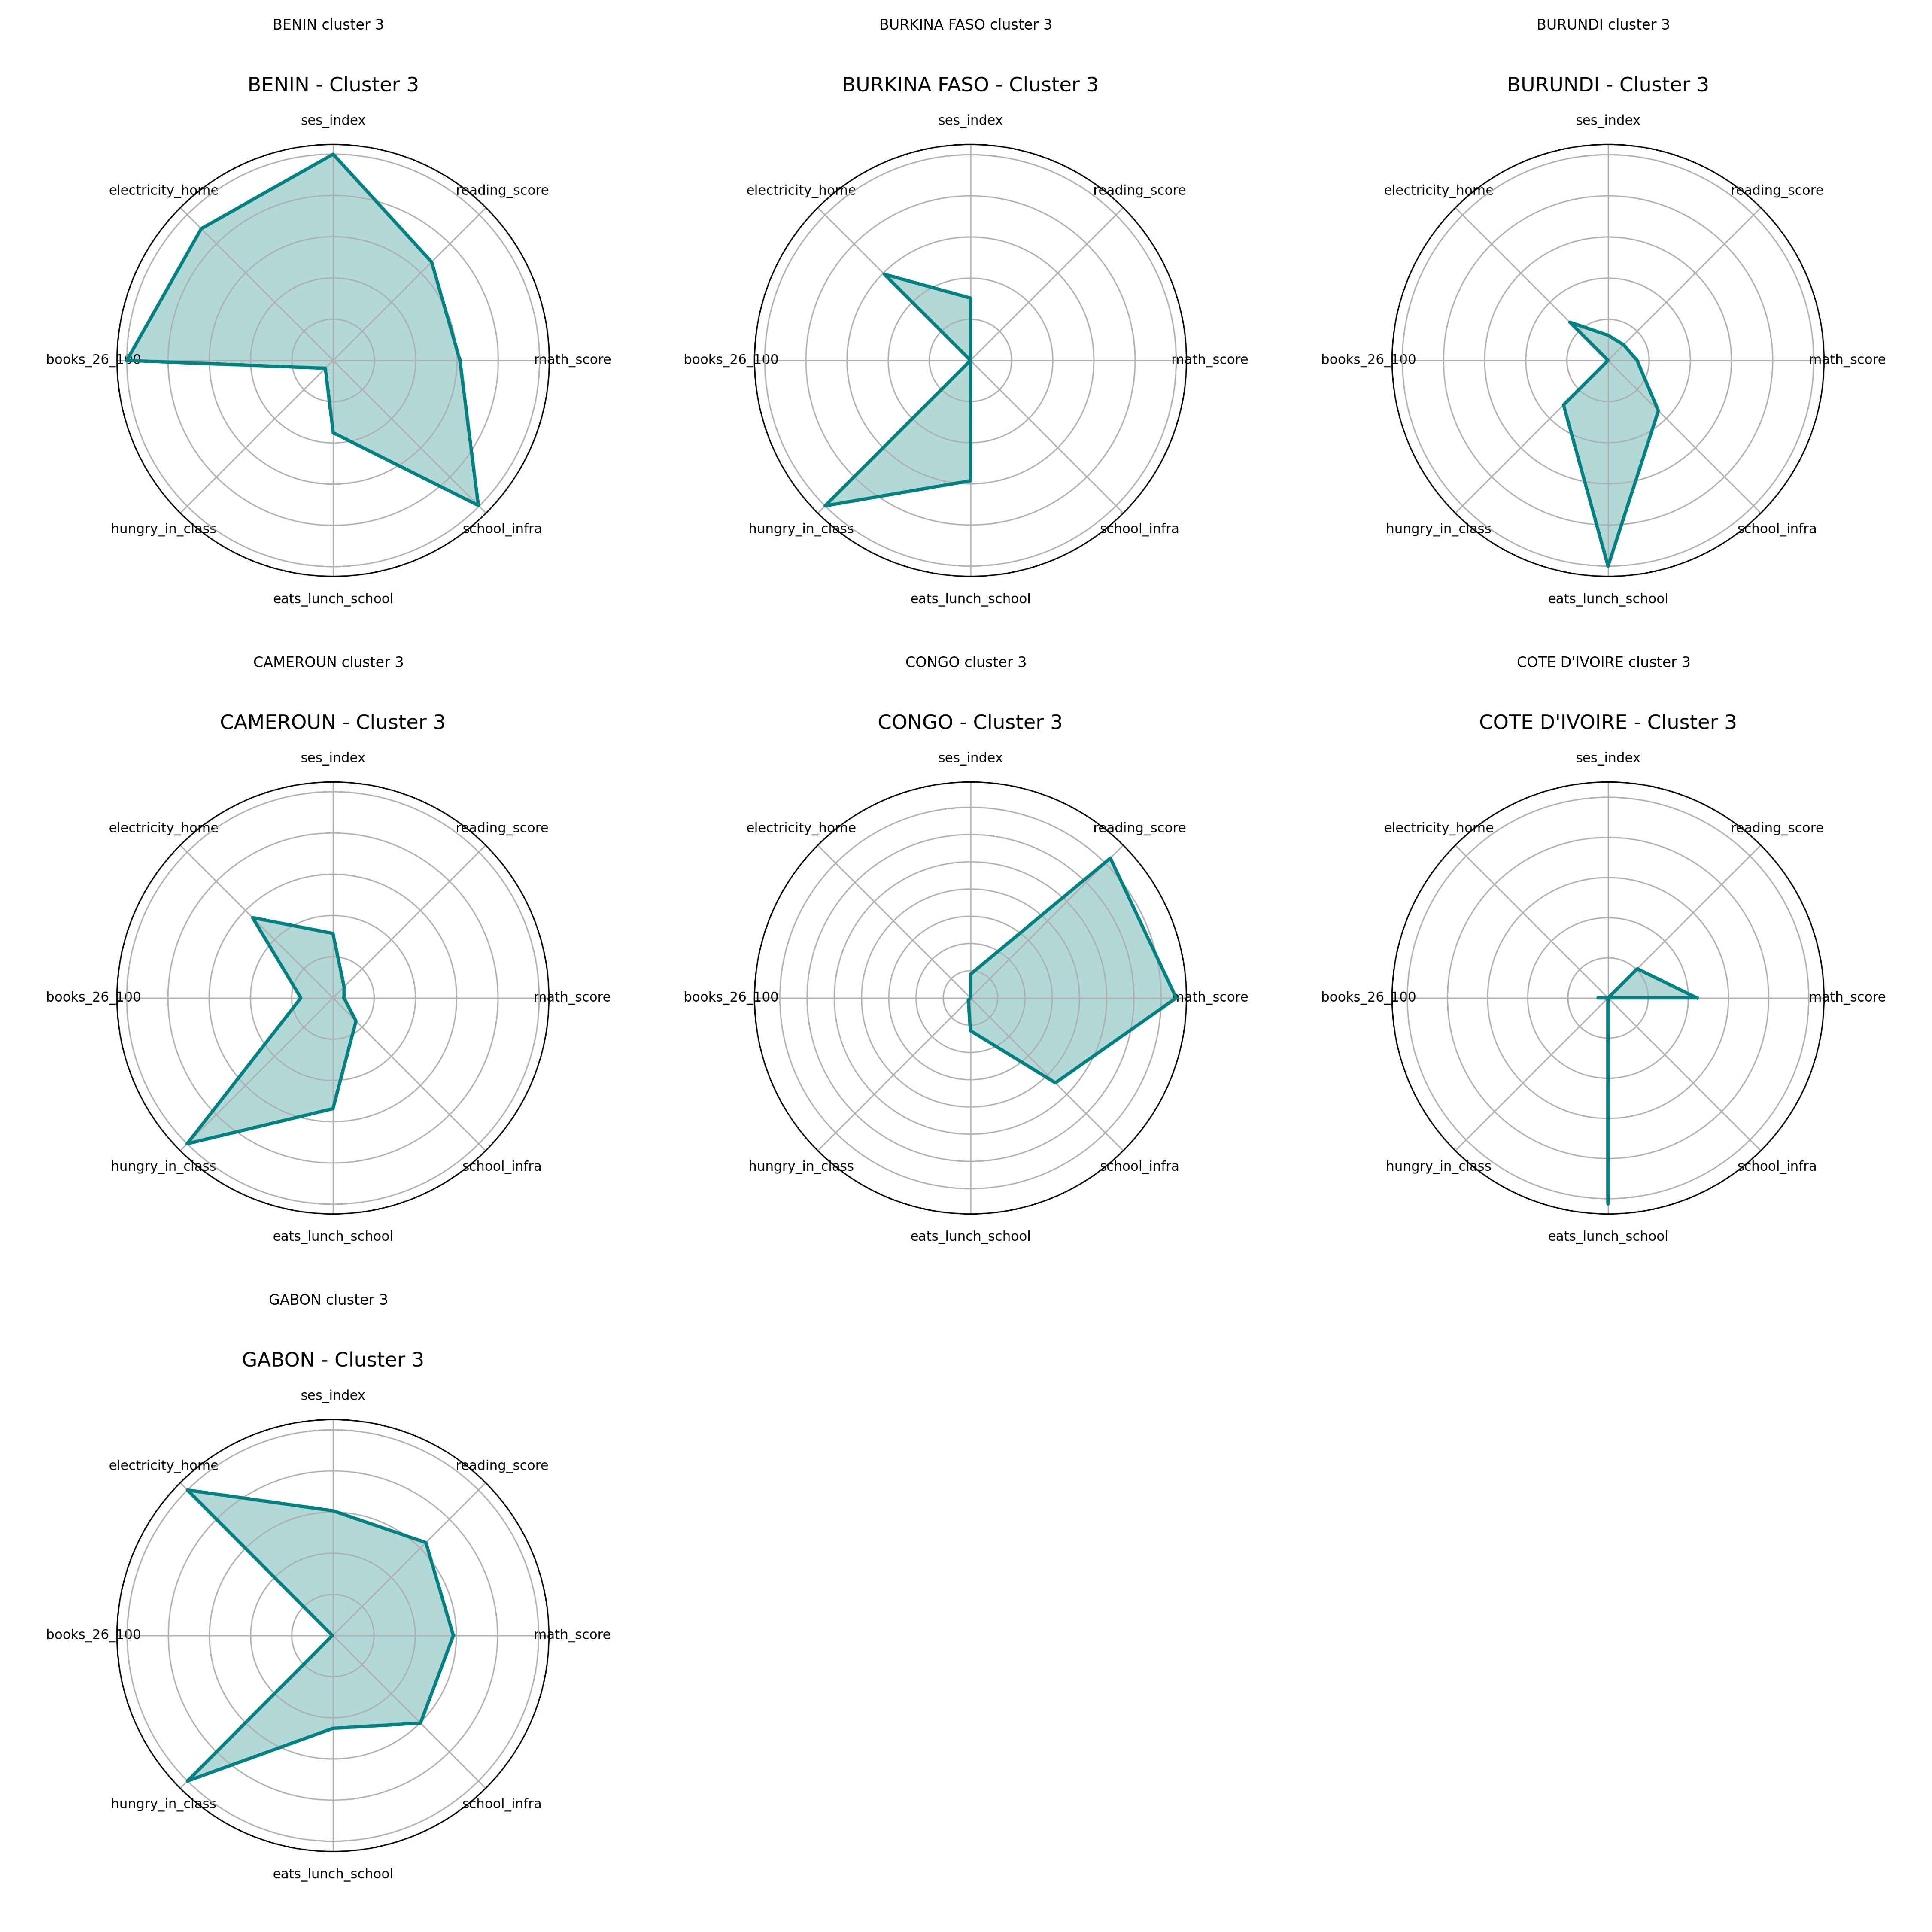
Radar Charts – Cluster 3
🎯 Applications
- Identify at-risk students with both low performance and difficult living conditions
- Tailor targeted education interventions by cluster
- Support evidence-based education policy design at national and regional levels
🌐 Resources
- 📄 Data: PASEC 2019 – CONFEMEN
- 💻 Code & Analysis: My GitHub
📌 Broader Implications
The curse of dimensionality is not unique to education. It’s a core challenge in:
- Public health
- Energy access
- Financial inclusion
- Labor market segmentation
As big data grows in complexity, machine learning methods like clustering become essential for unlocking actionable insights.
🏷️ Tags
#MachineLearning, #DBSCAN, #PCA, #Python, #EducationPolicy, #DataScience, #Clustering, #PASEC, #PublicPolicy, #Africa, #UnsupervisedLearning