🔍 One of the major goals of market analysis is to understand how prices move and how trends/cycles emerge over time.
But explaining these dynamics is tricky, even for practitioners. As any trader will tell you: sometimes, explaining risk management to a newcomer is harder than placing the trades themselves! 😅
👉 Launch the Interactive App ▶
📉 The Reality Behind Price Action
Markets don’t move in straight lines. They trend, consolidate, and revert: these are the rhythms of price cycles.
Understanding these movements helps to:
- anticipate momentum shifts,
- design robust trading/hedging rules, and
- make more informed portfolio decisions.
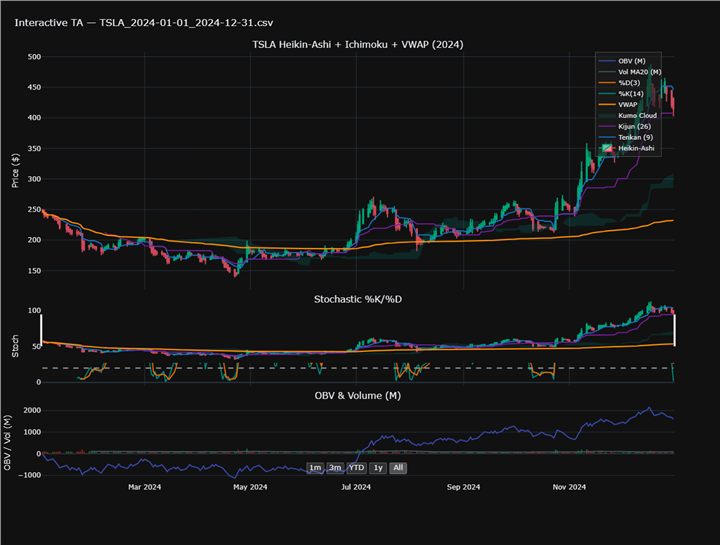
I illustrated this by analyzing Tesla (TSLA) in 2024 with a different toolkit:
- Heikin-Ashi (smoothed candles)
- Ichimoku (Tenkan/Kijun + Kumo Cloud)
- Anchored VWAP (volume-weighted mean price)
- Stochastic %K/%D (momentum oscillator)
- OBV & Volume (M) (flow/participation)
📊 Visualization
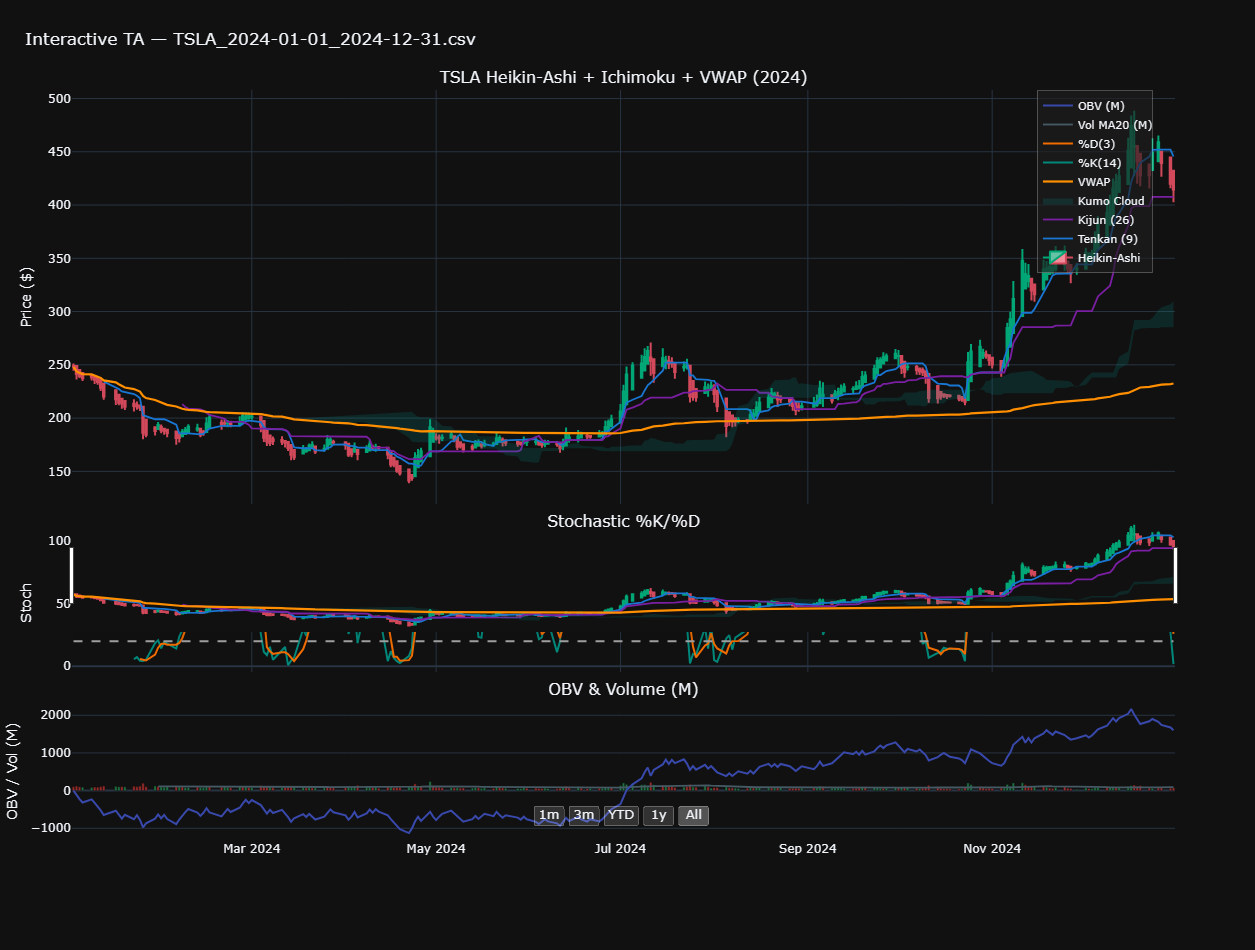
Legend:
- Heikin-Ashi: Smoothed price candles
- Tenkan (9) / Kijun (26): Ichimoku baselines
- Kumo Cloud: Span A/B volatility cloud
- VWAP: Anchored volume-weighted average price
- %K/%D: Stochastic oscillator
- OBV / Volume (M): On-Balance Volume & traded volume
🧰 Methodology & Data
- Period: 2024-01-01 → 2024-12-31
- Data source: Yahoo Finance via
yfinance - Indicators: Heikin-Ashi, Ichimoku, VWAP, Stoch %K/%D, OBV, Volume
- Tools used: Python (
pandas,plotly)
🧠 Why It Matters
Whether in cooking, medicine, or markets: precision matters.
- In cooking: a wrong dose can ruin the dish.
- In medicine: a milligram too much can have serious consequences.
- In trading: misreading a signal or reacting late can deepen drawdowns or miss opportunities.
⚖️ Does any of this work? The efficient-market objection
Technical analysis deserves an honest confrontation with the theory that rejects it.
The efficient market hypothesis (Fama, 1970) holds that prices continuously reflect all available information: past prices, public releases, and even private information. Under that reading, reading past prices should confer no durable edge: it is already in the price.
So why do practitioners still use these tools? Because the goal is not prophecy. Candlesticks, Heikin-Ashi, Ichimoku, VWAP, the Stochastic and OBV serve to detect trend and momentum, frame risk, and time execution, across horizons running from intraday algorithmic trading to long-term portfolio management.
The pragmatic position: rigorous out-of-sample backtests, transaction costs and frictions accounted for, and attention to documented anomalies (momentum, value, calendar effects) that can persist depending on horizon and regime. Technical analysis earns its keep by pacing risk and improving timing, not by predicting.
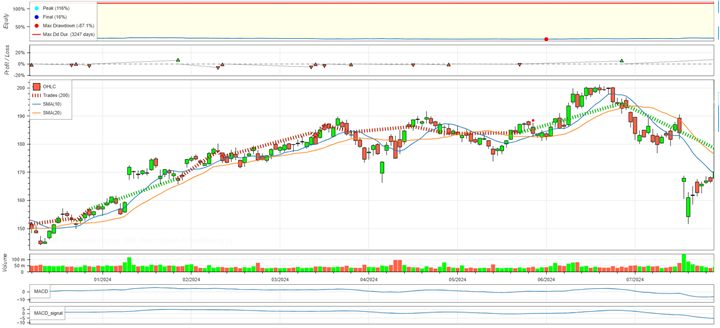
The MACD + SMA backtest in this collection puts that to the test, and reports a strategy that loses to buy-and-hold.
⚠️ Disclaimer
This is an educational tool and a demonstration of interactive visualisation (Python, Shiny for Python, Plotly) and web deployment. It is not investment advice.
📚 Suggested Readings
- Fama, E. F. (1970). Efficient capital markets: A review of theory and empirical work. The Journal of Finance, 25(2), 383–417.
- Hosoda, G.. Ichimoku Kinko Hyo
- Murphy, J. (1999). Technical Analysis of the Financial Markets
🏷️ Tags
#TSLA, #Ichimoku, #HeikinAshi, #VWAP, #Stochastic, #OBV, #TechnicalAnalysis, #Plotly, #Python, #yfinance