
AAPL 2022 — Interactive Technical Analysis (Light Theme)
🔍 One of the major goals of market analysis is to understand how prices move and how trends/cycles emerge over time.
But explaining these dynamics is tricky—even for practitioners. As any trader will tell you: sometimes, explaining risk management to a newcomer is harder than placing the trades themselves! 😅
📉 The Reality Behind Price Action
Markets don’t move in straight lines. They trend, consolidate, and revert—these are the rhythms of price cycles.
Understanding these movements helps to:
- anticipate momentum shifts,
- design robust trading/hedging rules, and
- make more informed portfolio decisions.
I illustrated this by analyzing Apple (AAPL) over 2022 using classic technical indicators:
- EMA20 & EMA50 (trend)
- Bollinger Bands (20,2) (volatility envelope)
- RSI(14) (momentum)
- Volume (M) (participation)
📊 Visualization
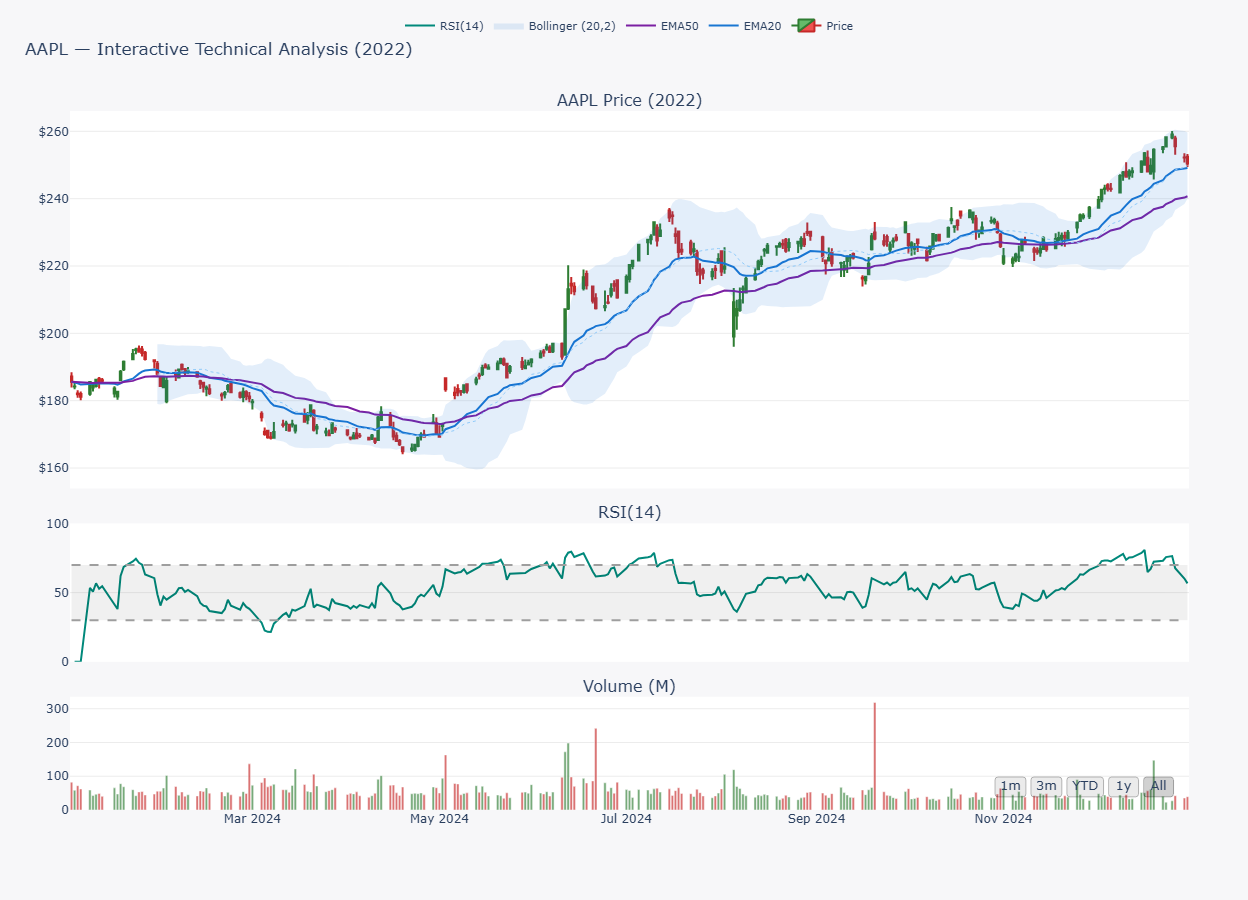
Legend:
- Candlesticks: Daily price
- EMA20 / EMA50: Short/medium-term trend
- Bollinger (20,2): Upper/Lower bands + midline
- RSI(14): Momentum gauge
- Volume (M): Traded volume in millions
🧰 Methodology & Data
- Period: 2022-01-01 → 2023-01-01
- Data source: Yahoo Finance via
yfinance - Indicators: EMA20/50, Bollinger(20,2), RSI(14), Volume
- Tools used: Python (
pandas,plotly,talib)
🧠 Why It Matters
Whether in cooking, medicine, or markets—precision matters.
- In cooking: a wrong dose can ruin the dish.
- In medicine: a milligram too much can have serious consequences.
- In trading: misreading a signal or reacting late can deepen drawdowns or miss opportunities.
📚 Suggested Readings
- Murphy, J. (1999) — Technical Analysis of the Financial Markets
- Elder, A. (2014) — The New Trading for a Living
🏷️ Tags
#AAPL, #TechnicalAnalysis, #EMA, #BollingerBands, #RSI, #Volume, #Plotly, #Python, #yfinance