
Nobel Prize in Economics – A Data Exploration
📊 The Economics Nobel Over Time – A Visual and Analytical Deep Dive
The Nobel Prize in Economics tells a story beyond medals. Behind each award lies decades of research, evolving paradigms, and the silent trends shaping modern economic thought.
🔍 Key Questions I Explored
- How old are laureates when they receive the prize?
- What themes are most frequently honored?
- Which institutions and countries dominate?
- How has gender diversity evolved?
- What do the places of birth reveal about global research concentration?
🔬 Methodology
- Data: Nobel Prize dataset from Kaggle (compiled by Sazid Rahman)
- Tools: Python –
Pandas,Matplotlib,Seaborn,WordCloud
🧠 Highlights
📈 Laureates’ Age Over Time
Most economists are awarded between ages 65 and 70 — a reminder that economics is a cumulative and patient science. 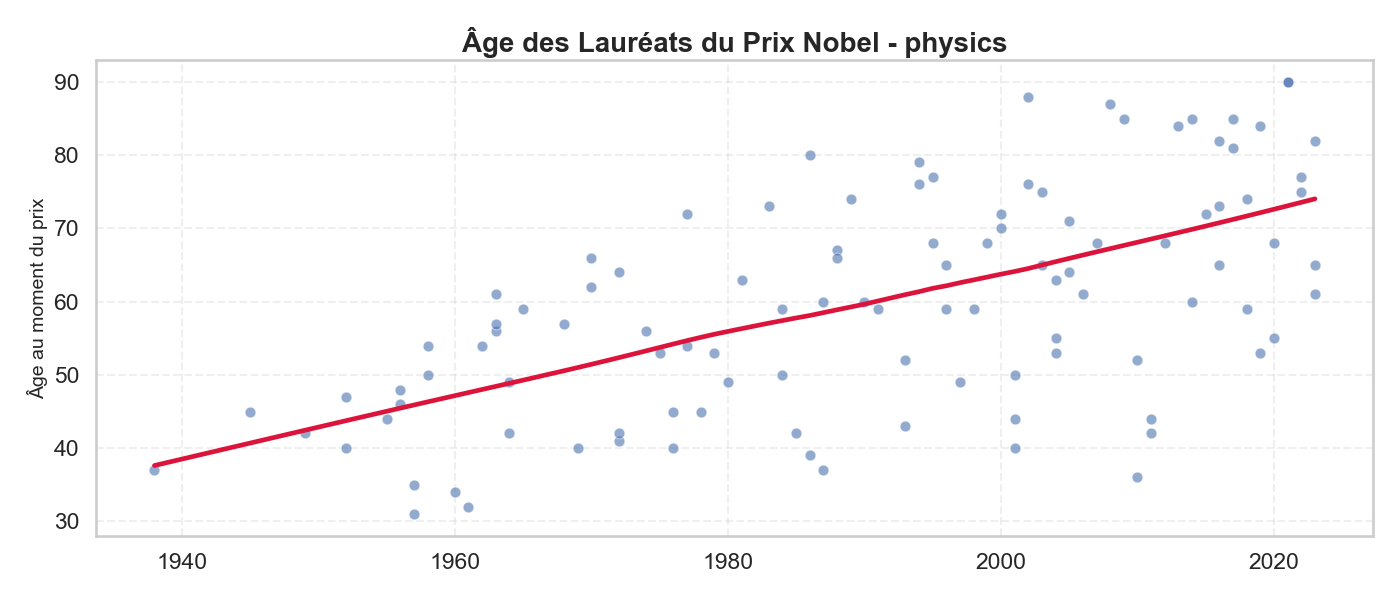
🌎 Countries of Birth
The United States dominates the list of Nobel laureates in economics, followed distantly by the UK, Canada, and France. 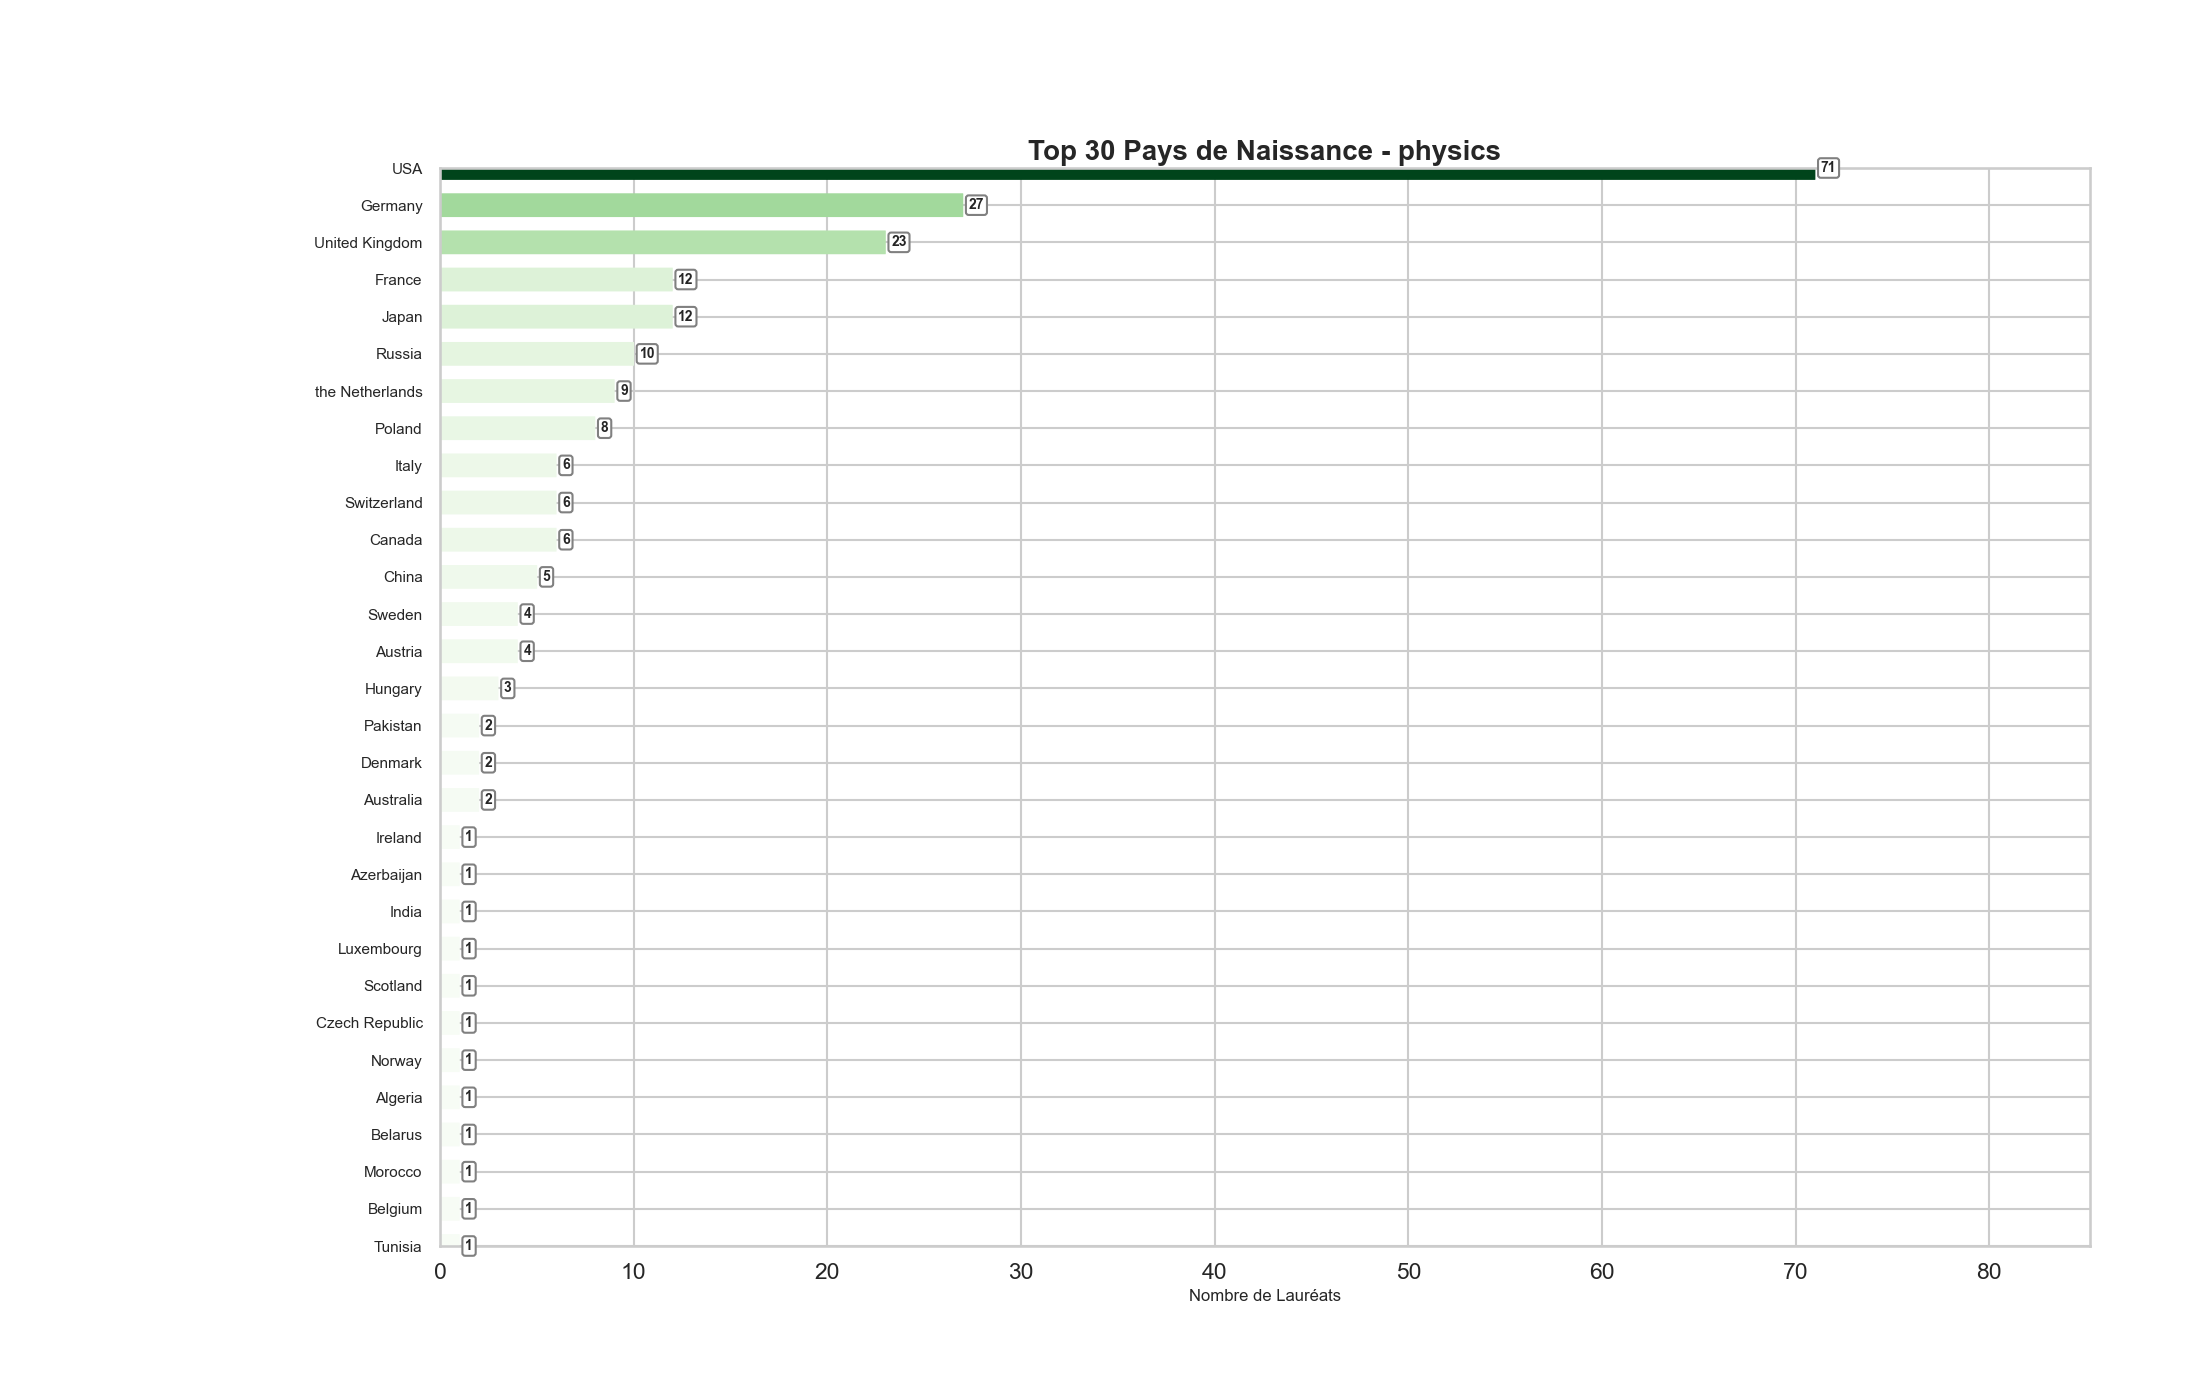
🏙️ Cities of Birth
New York, Boston, and Chicago top the chart — revealing the urban roots of many top economists. 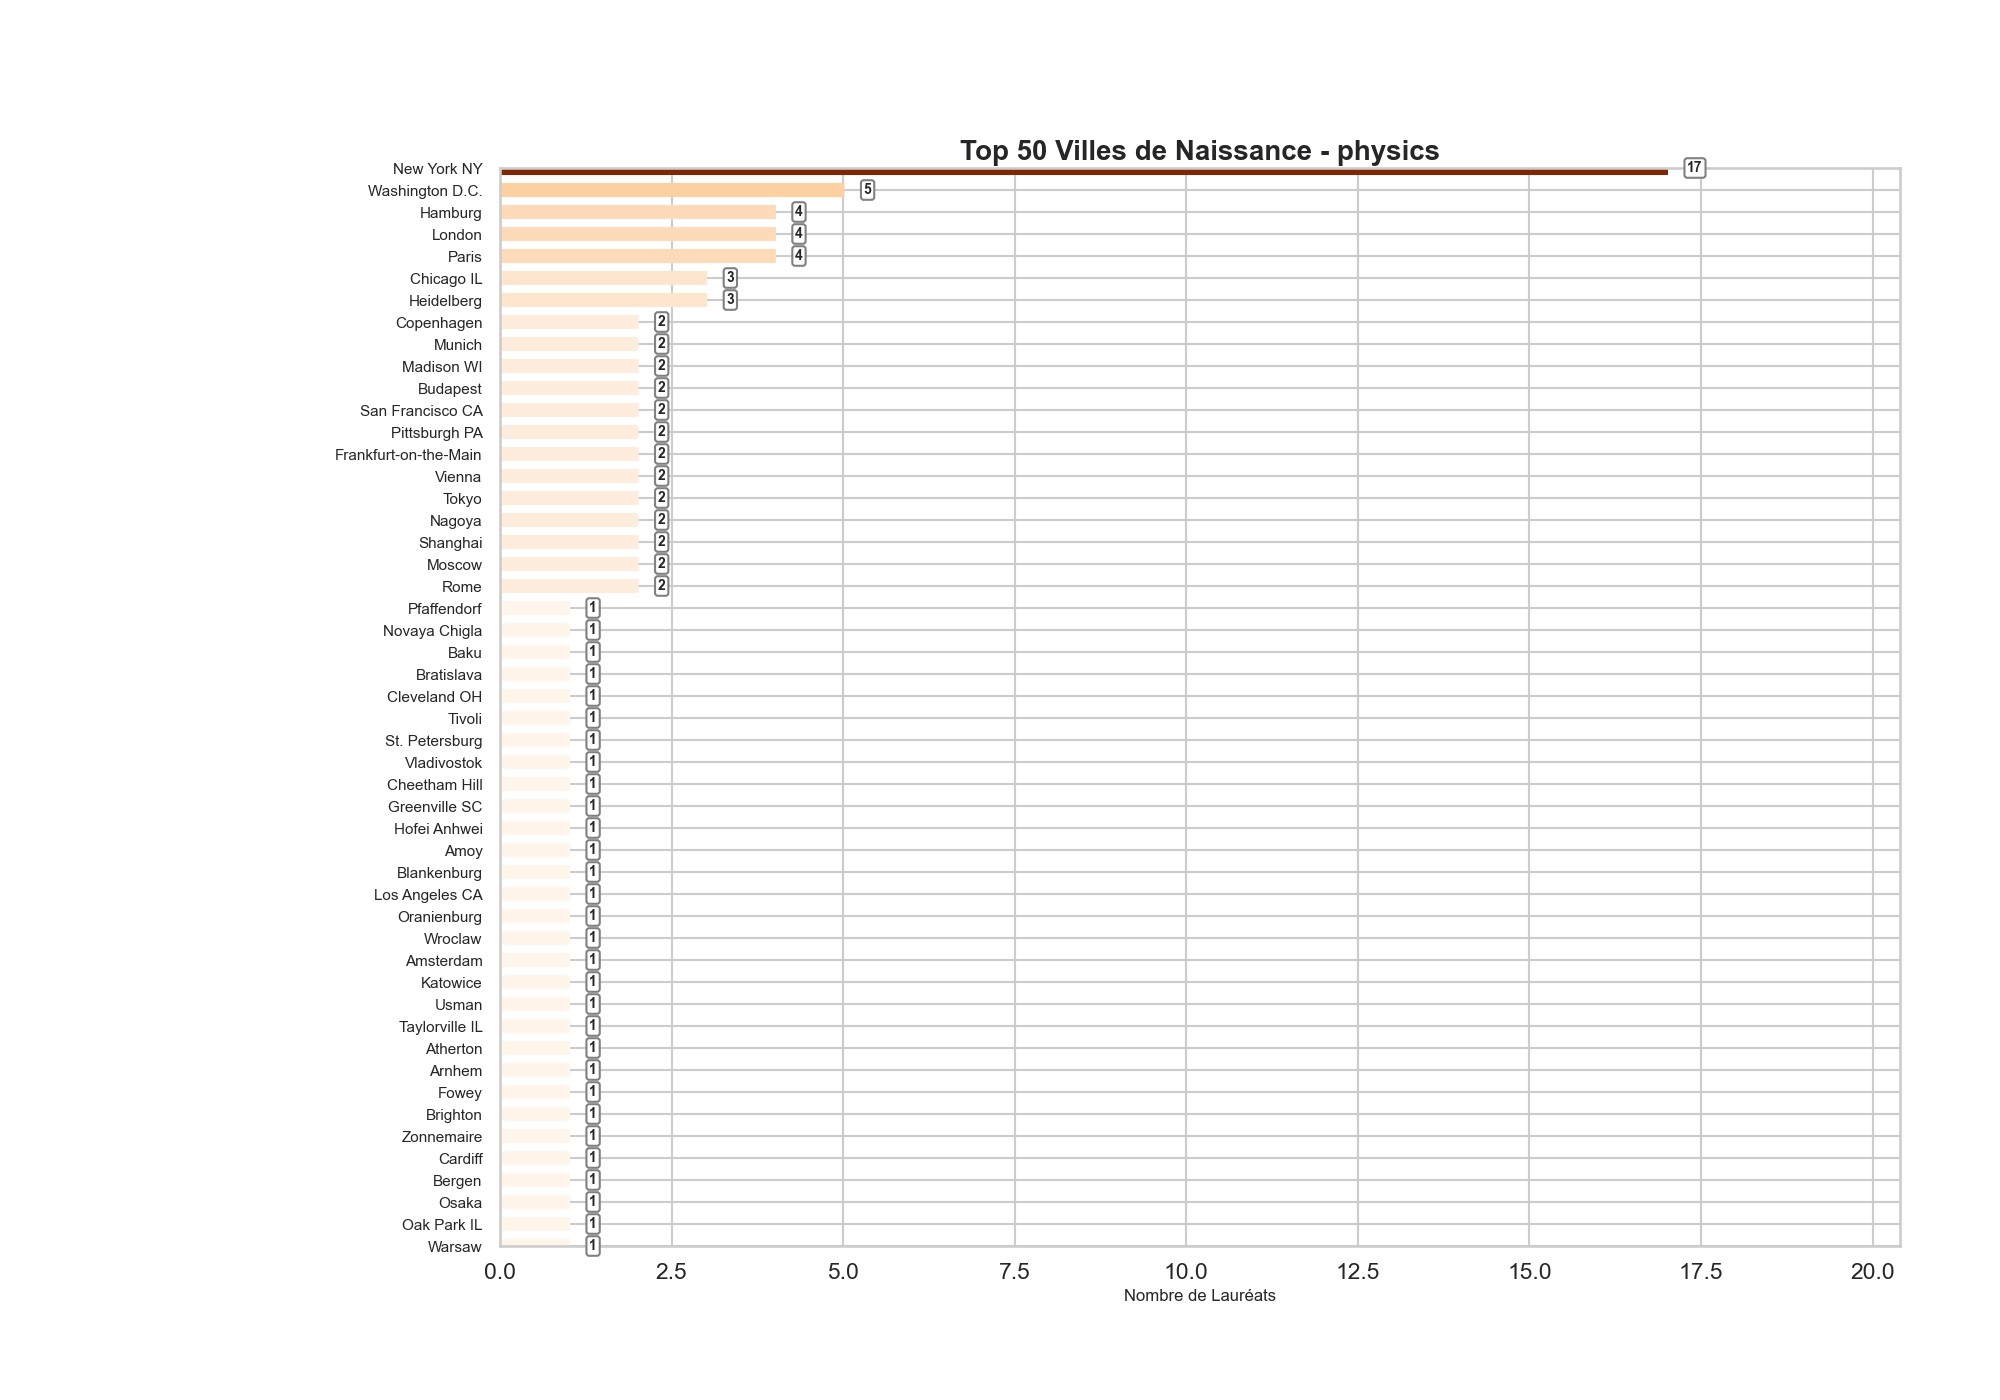
🎓 Top Institutions
University of Chicago, Harvard, and MIT lead — both as intellectual hubs and symbols of scientific recognition. 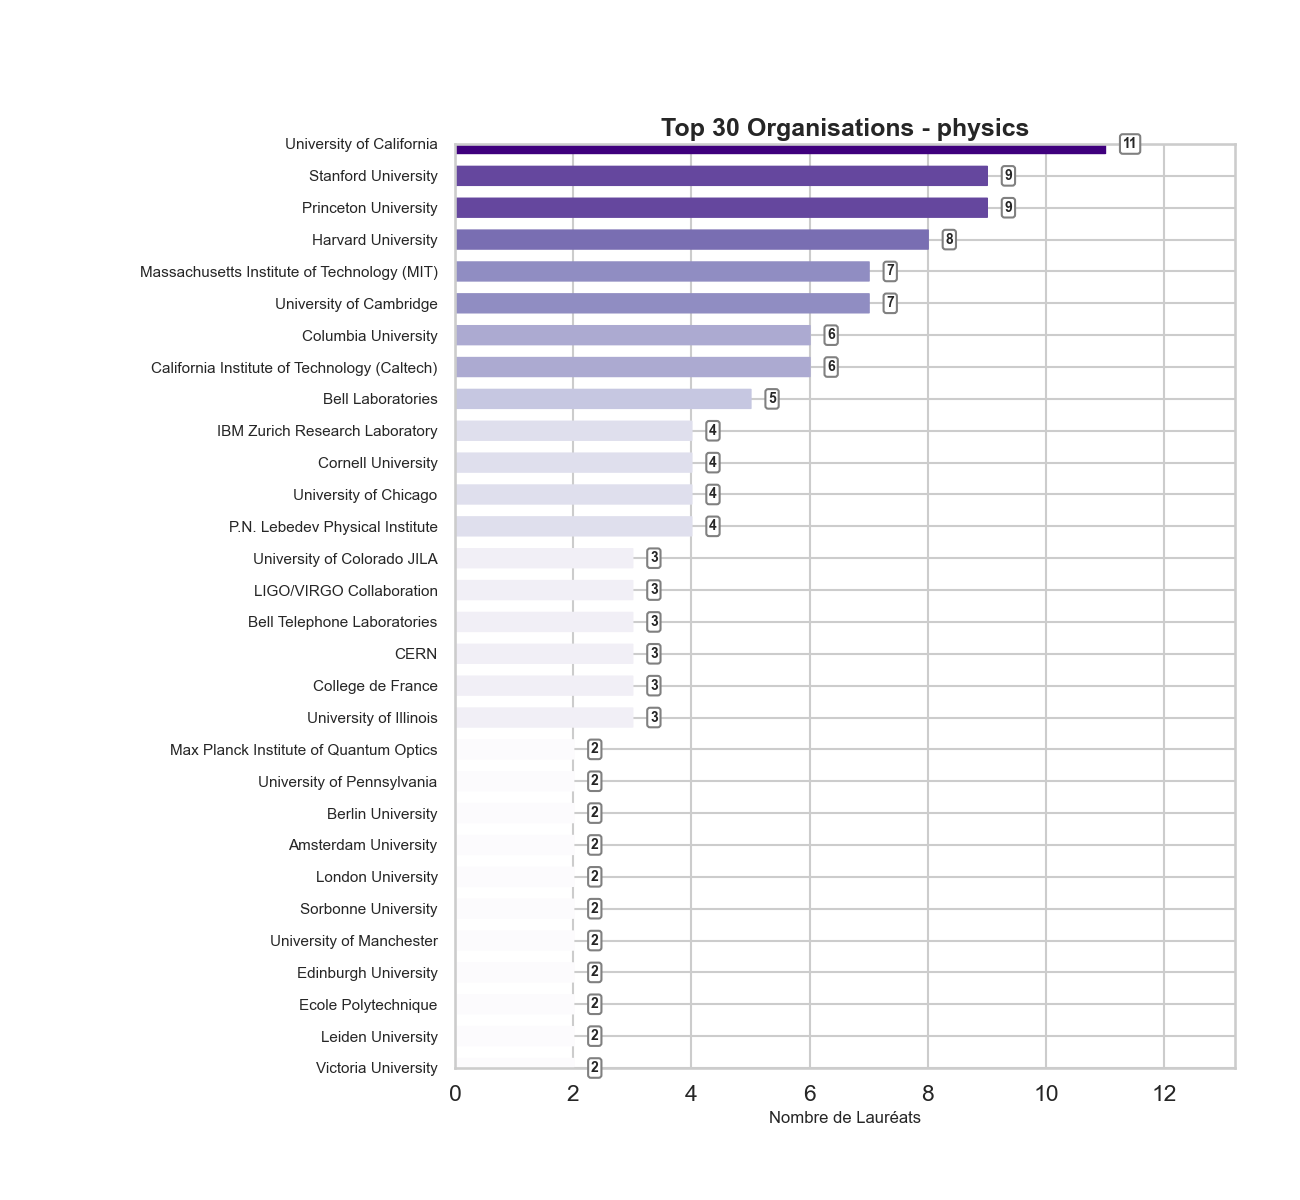
💬 Word Cloud of Motivation Texts
Themes such as theory, contribution, analysis, market, and policy dominate official Nobel motivations. 
👥 Gender Representation
Out of dozens of laureates, only a handful are women — but names like Elinor Ostrom, Esther Duflo, and Claudia Goldin represent crucial steps toward inclusion. 
📚 Reflections
The Nobel isn’t just a celebration of individual achievement. It reflects:
- The evolving dominant paradigms in economics
- The concentration of academic recognition
- Gaps in geographic and gender inclusion
It’s a mirror to how we value knowledge, and a call to keep questioning what — and who — we recognize in science.
📂 Want to Explore the Code?
📁 Data: Kaggle Dataset - Nobel Laureates
🏷 Tags
#DataScience, #Economics, #NobelPrize, #Python, #Research, #DataViz, #Matplotlib, #GenderInequality, #AcademicRecognition