
Canada Housing Analytics — Interactive Dashboard
🔍 One of the major goals of housing analysis is to understand how rental markets vary across regions and over time.
👉 Launch the App ▶
➡ Project Details ▶
🧭 Objective
Provide an interactive, province-level view of rental market indicators to better track affordability and dynamics across Canada.
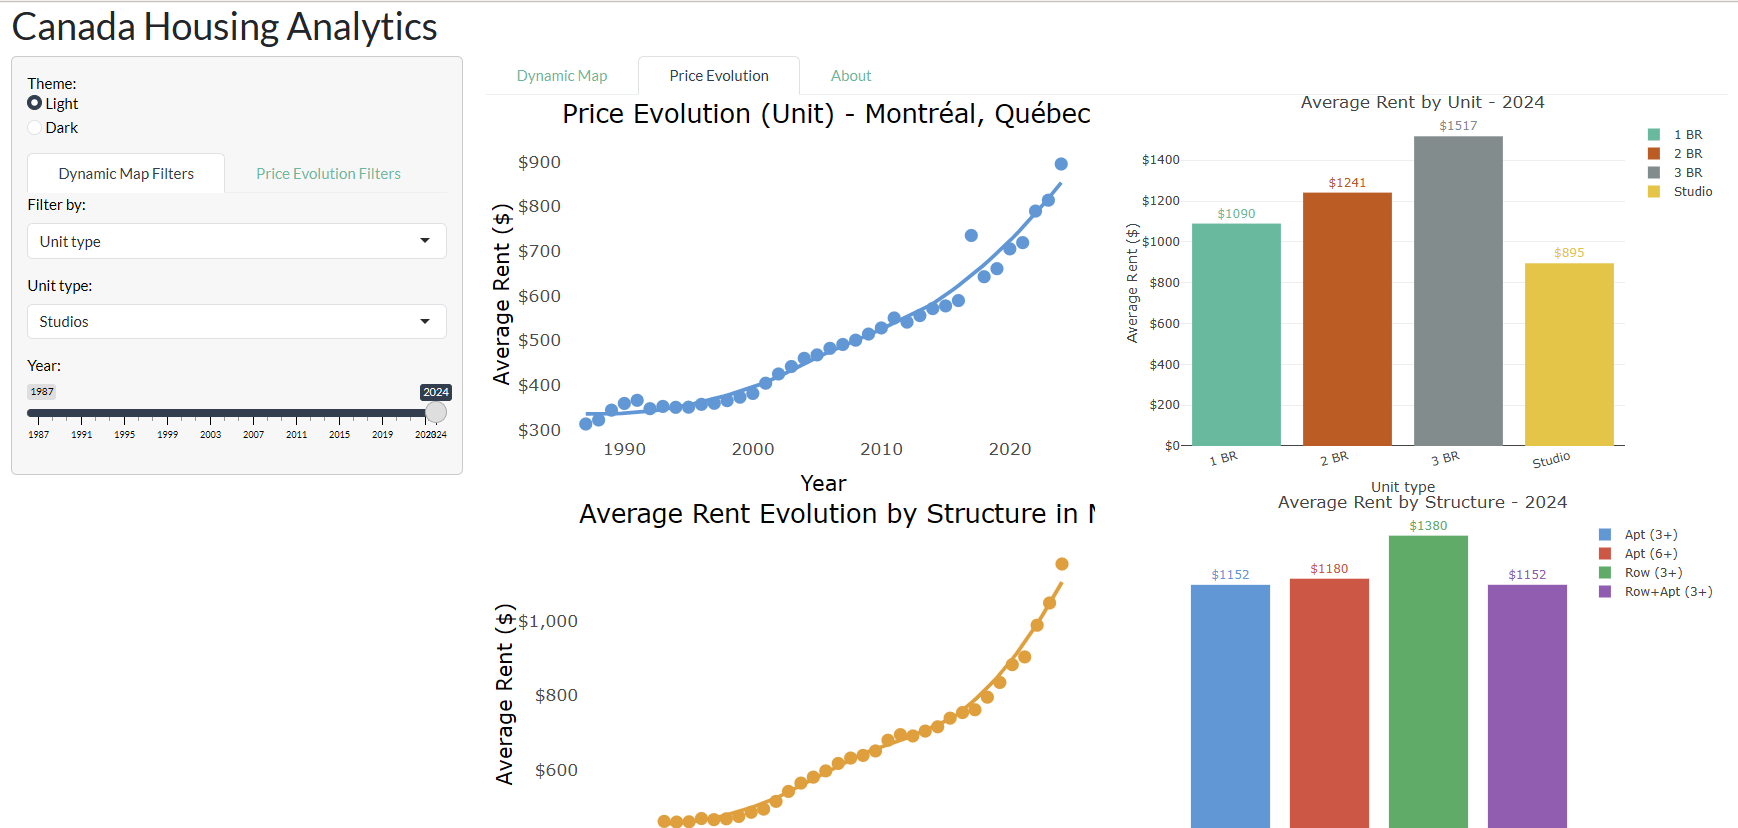
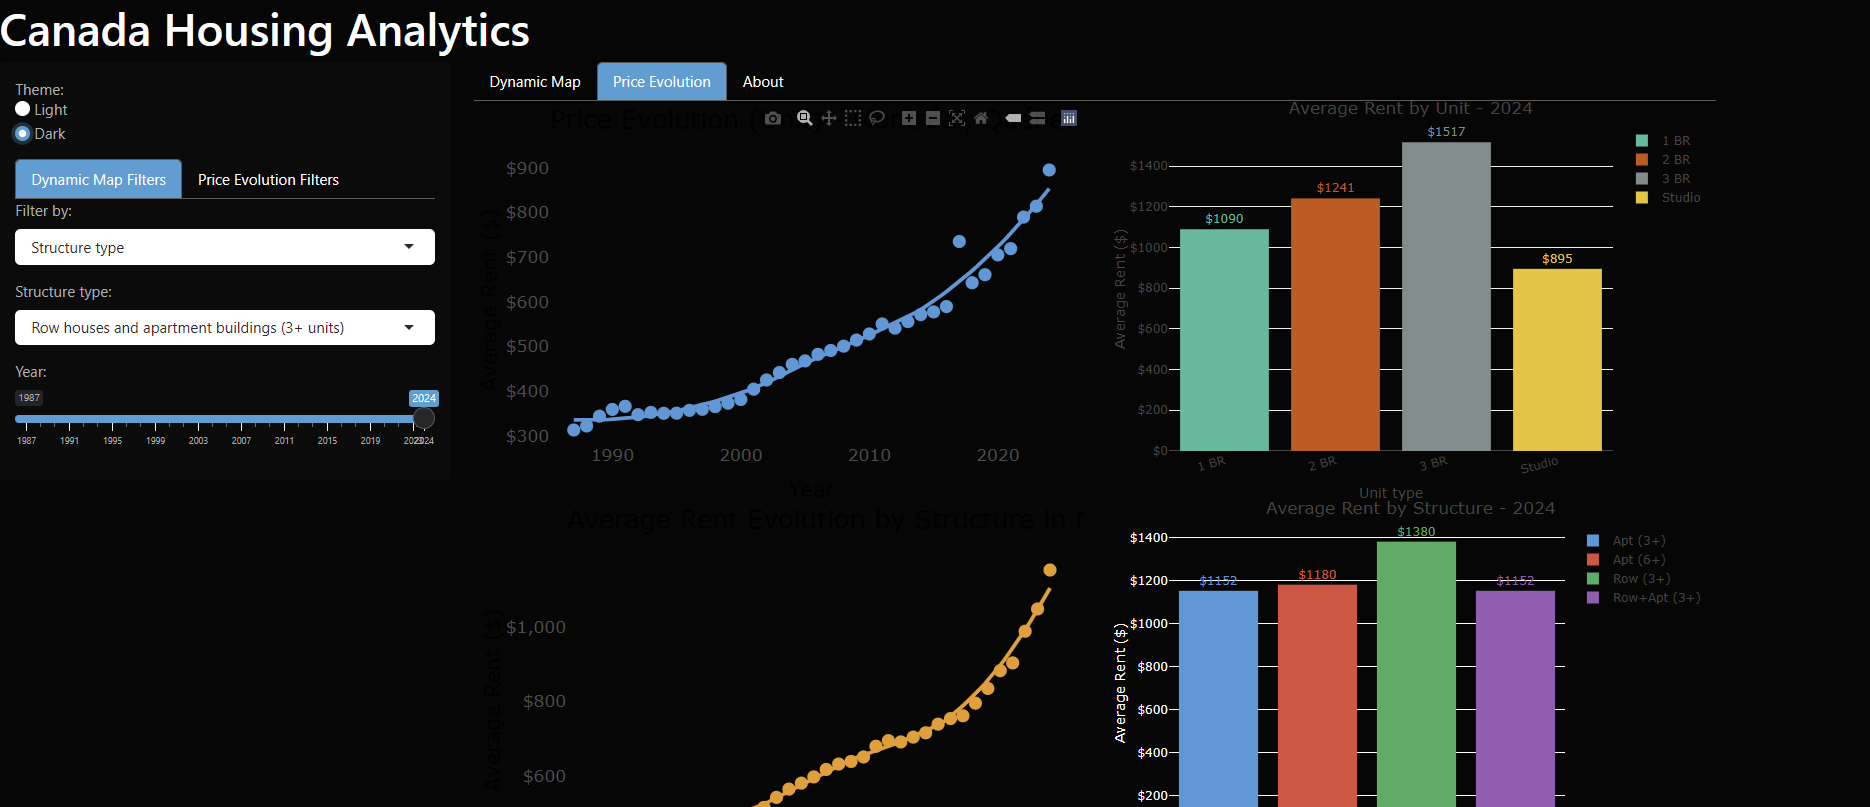
📊 Visualizations
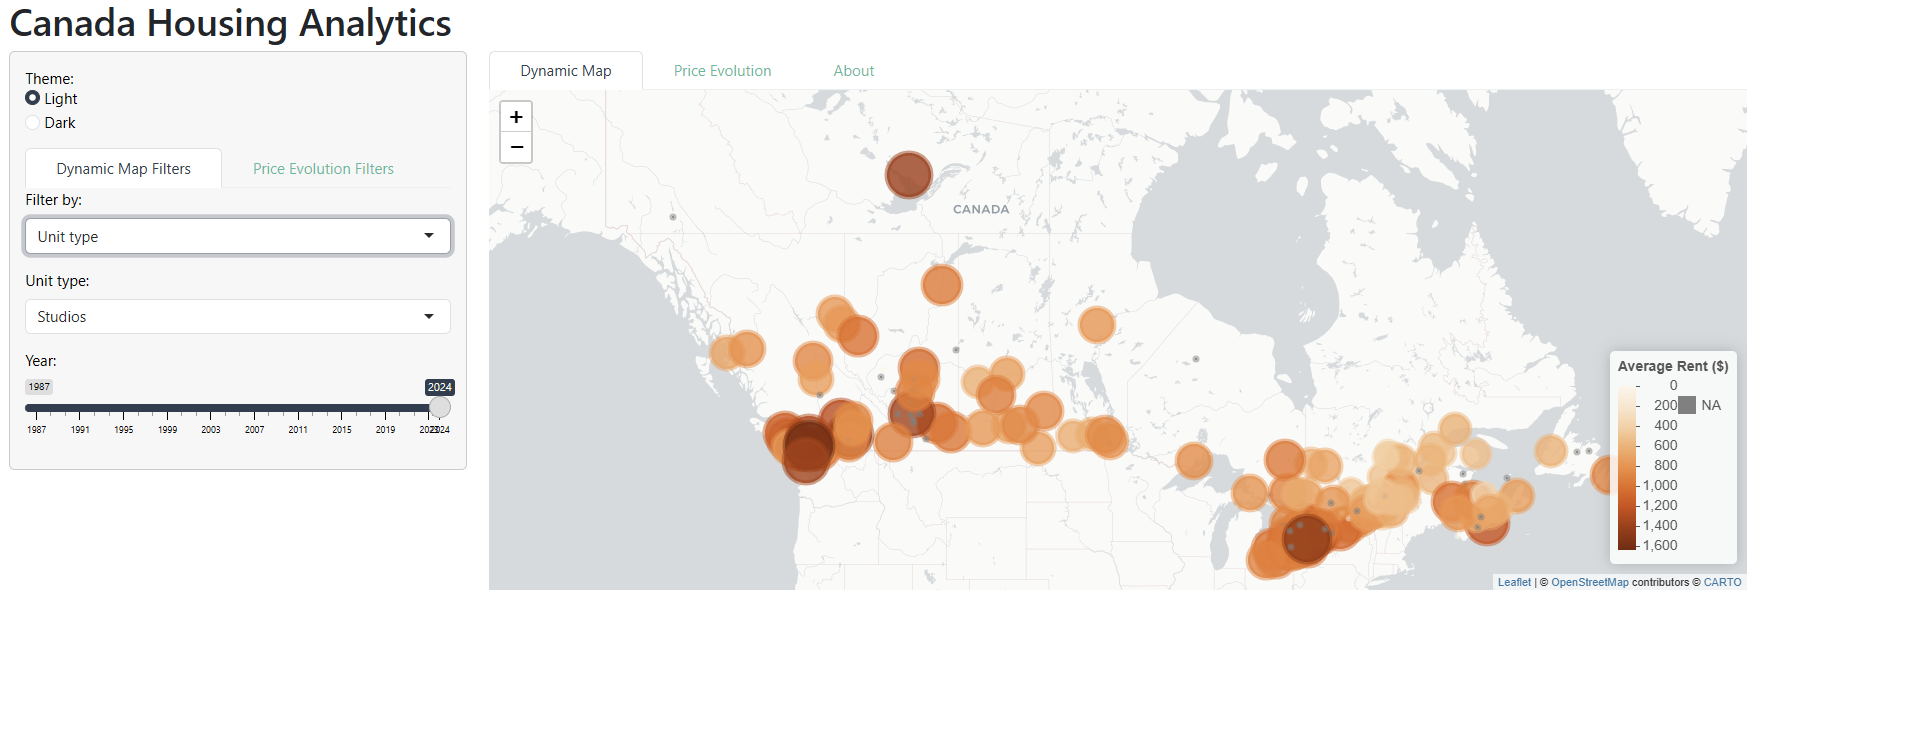
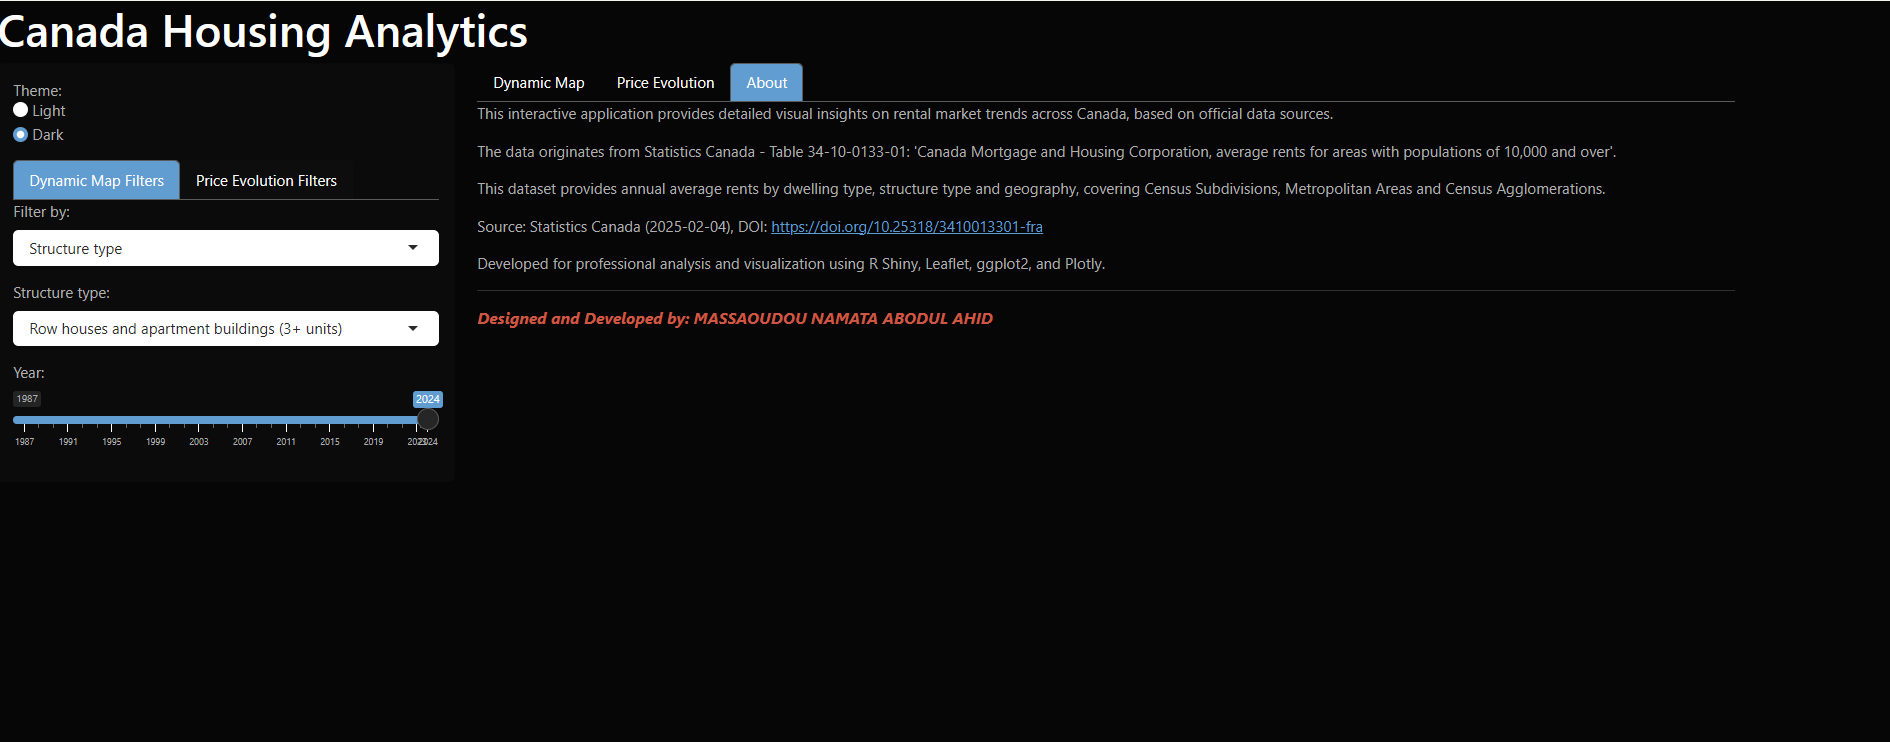
🧰 Methodology & Data
- Source: Statistics Canada (official rental/housing indicators)
- Period: 2023–2025 (rolling updates)
- Tools: R, Shiny,
tidyverse,plotly,DT - Features: province filters, time slicing, indicator comparison, downloadable tables
🎯 Applications
- Help policymakers identify high-pressure rental areas
- Support students and households comparing rents across provinces
- Facilitate media/analysis on affordability trends
🗓 Completion
June 2025