
Effect of Chinese Financial Flows on Economic Growth
This study examines the impact of Chinese financial flows on the economic growth of recipient countries, using AidData, which covers 20,985 projects in 165 low- and middle-income countries over the period 2000-2023. We employ three empirical approaches: the within-country estimator, the instrumental variable estimator using China’s steel production as an instrument, and the dynamic panel model with the Arellano and Bond specification. Our results indicate a positive relationship between Chinese financial flows and the economic growth of recipient countries. The within-country estimator shows a positive impact, as does the instrumental variable approach, which produces positive and significant coefficients. However, the results of the dynamic panel model are not significant. Long-term effects are evident in five-year averages, particularly in infrastructure-related investments. The positive impact is more pronounced in America than in Africa and Asia. Additionally, our results reveal a crowding-out effect on domestic investment.
Additional Visuals:
Trends in Chinese Financial Flows
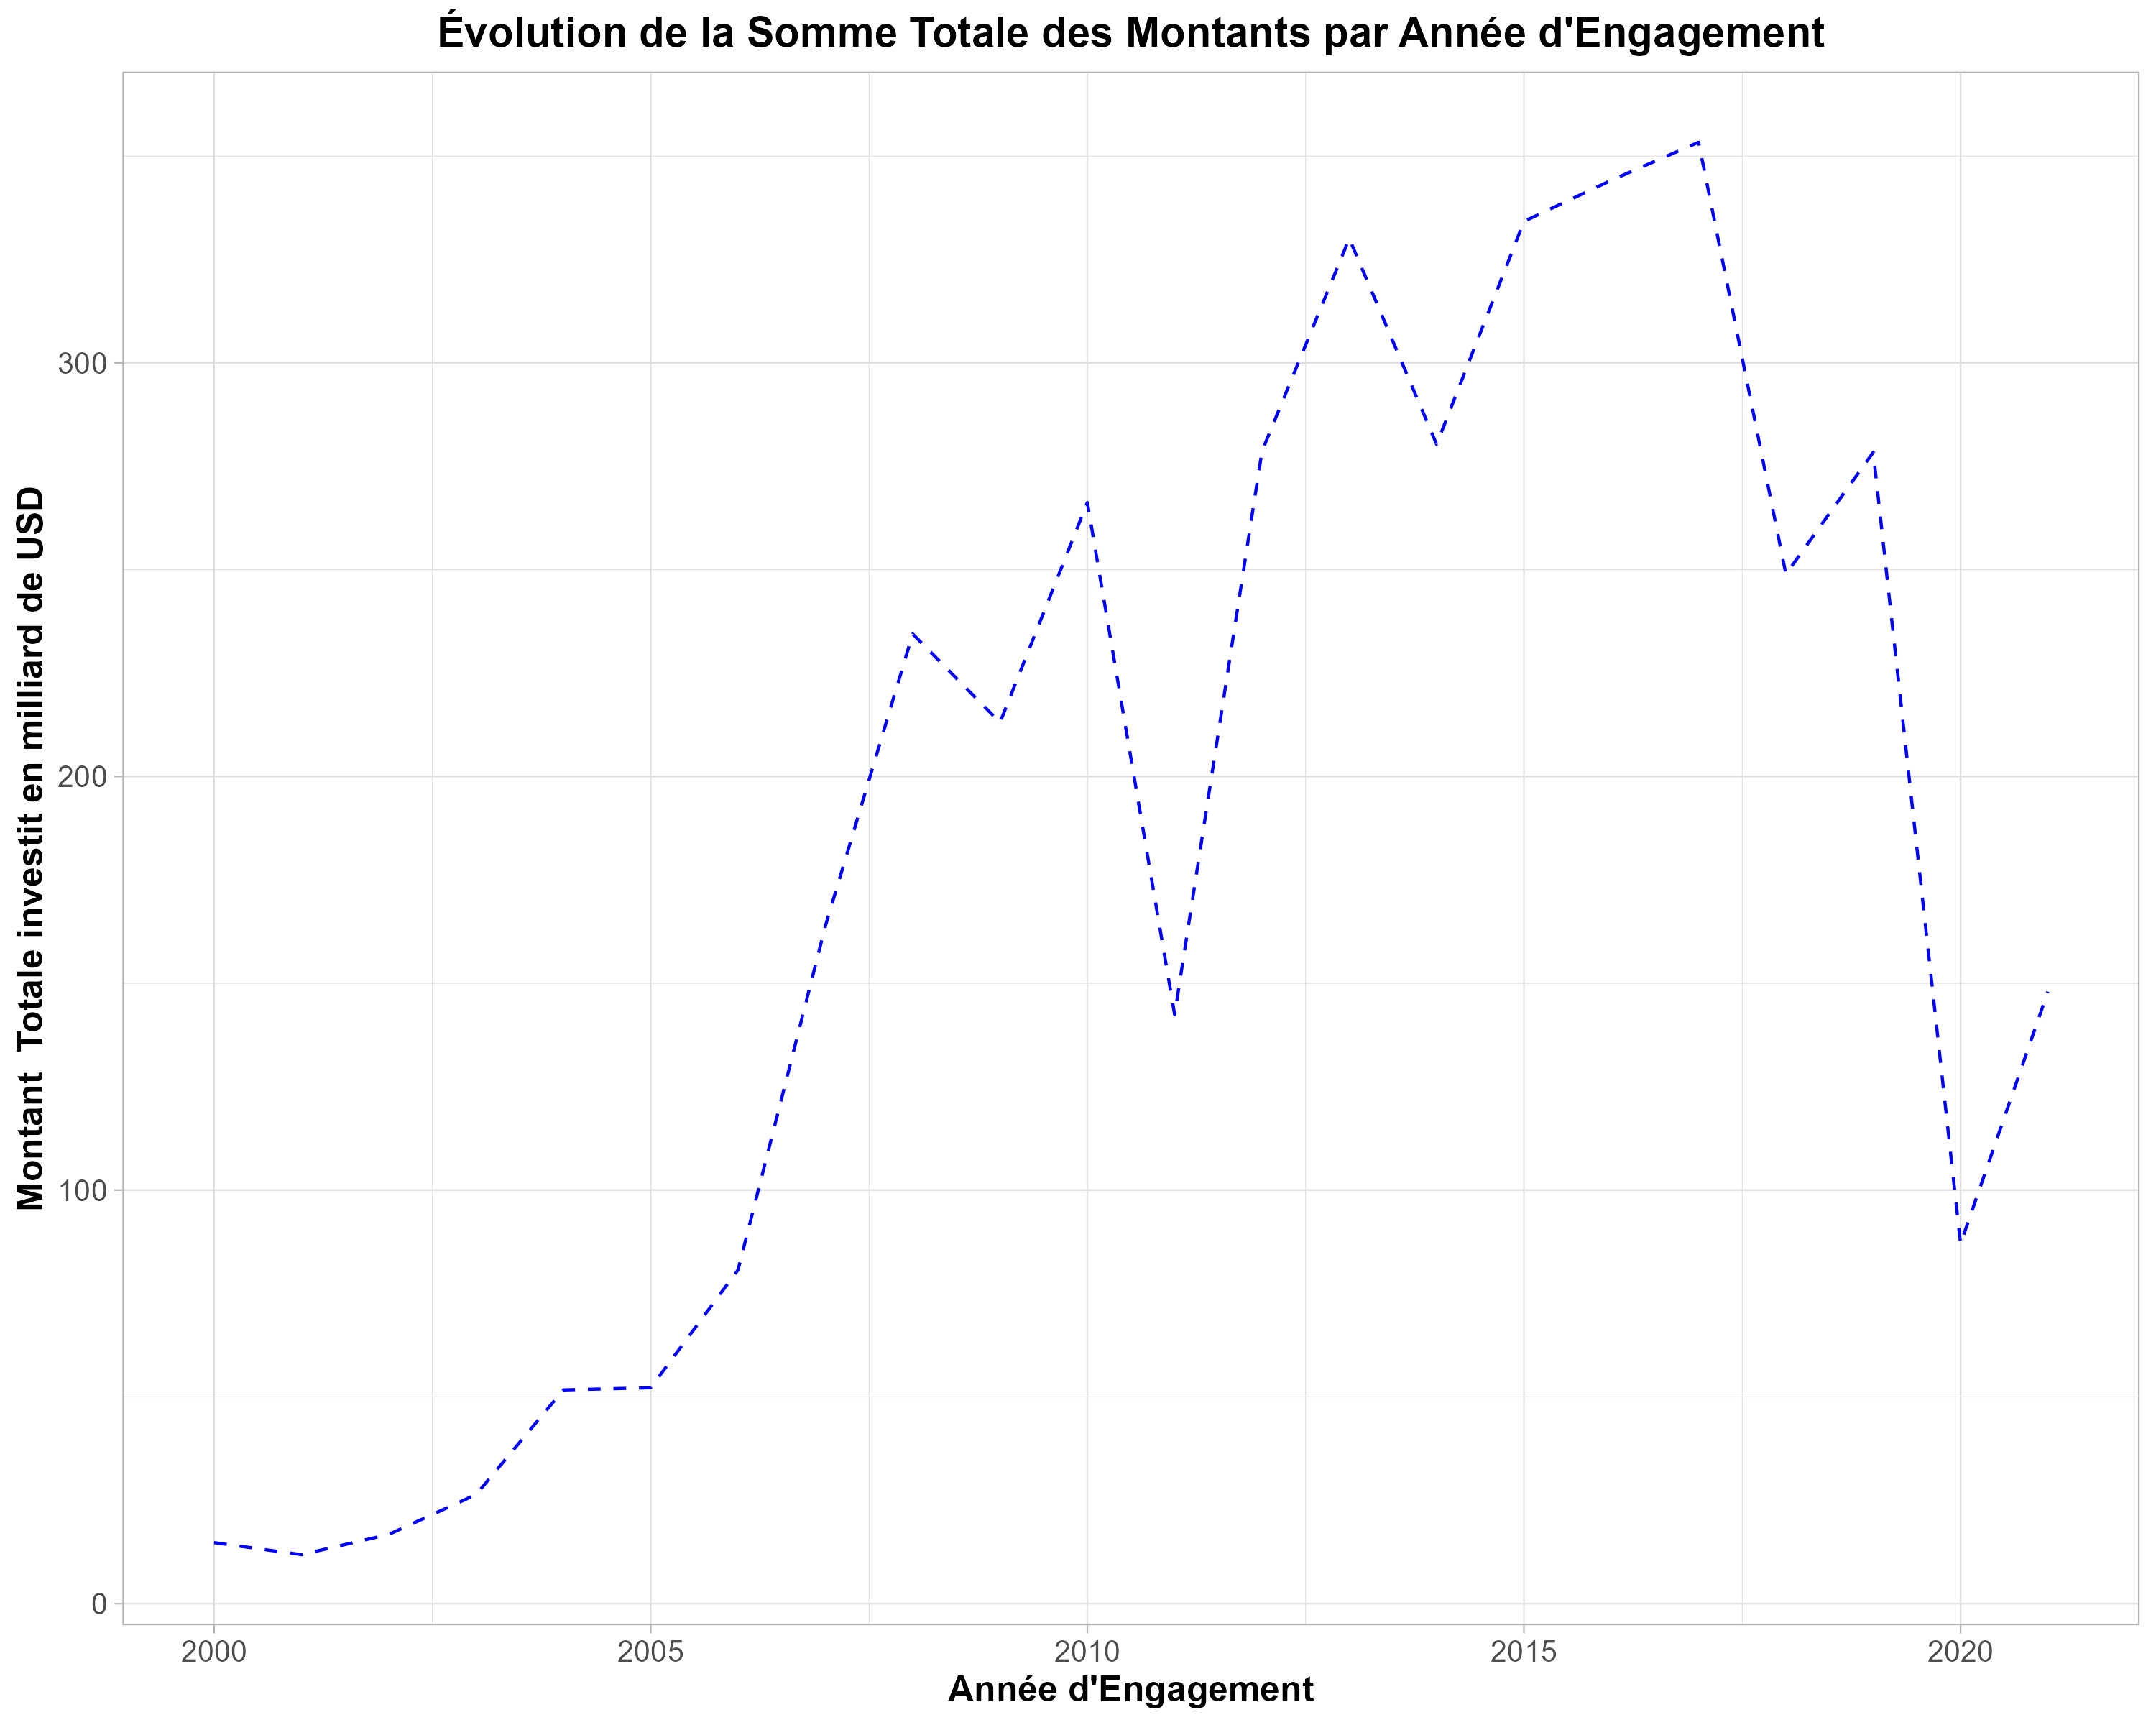 “Trends in Chinese Financial Flows Over Time”
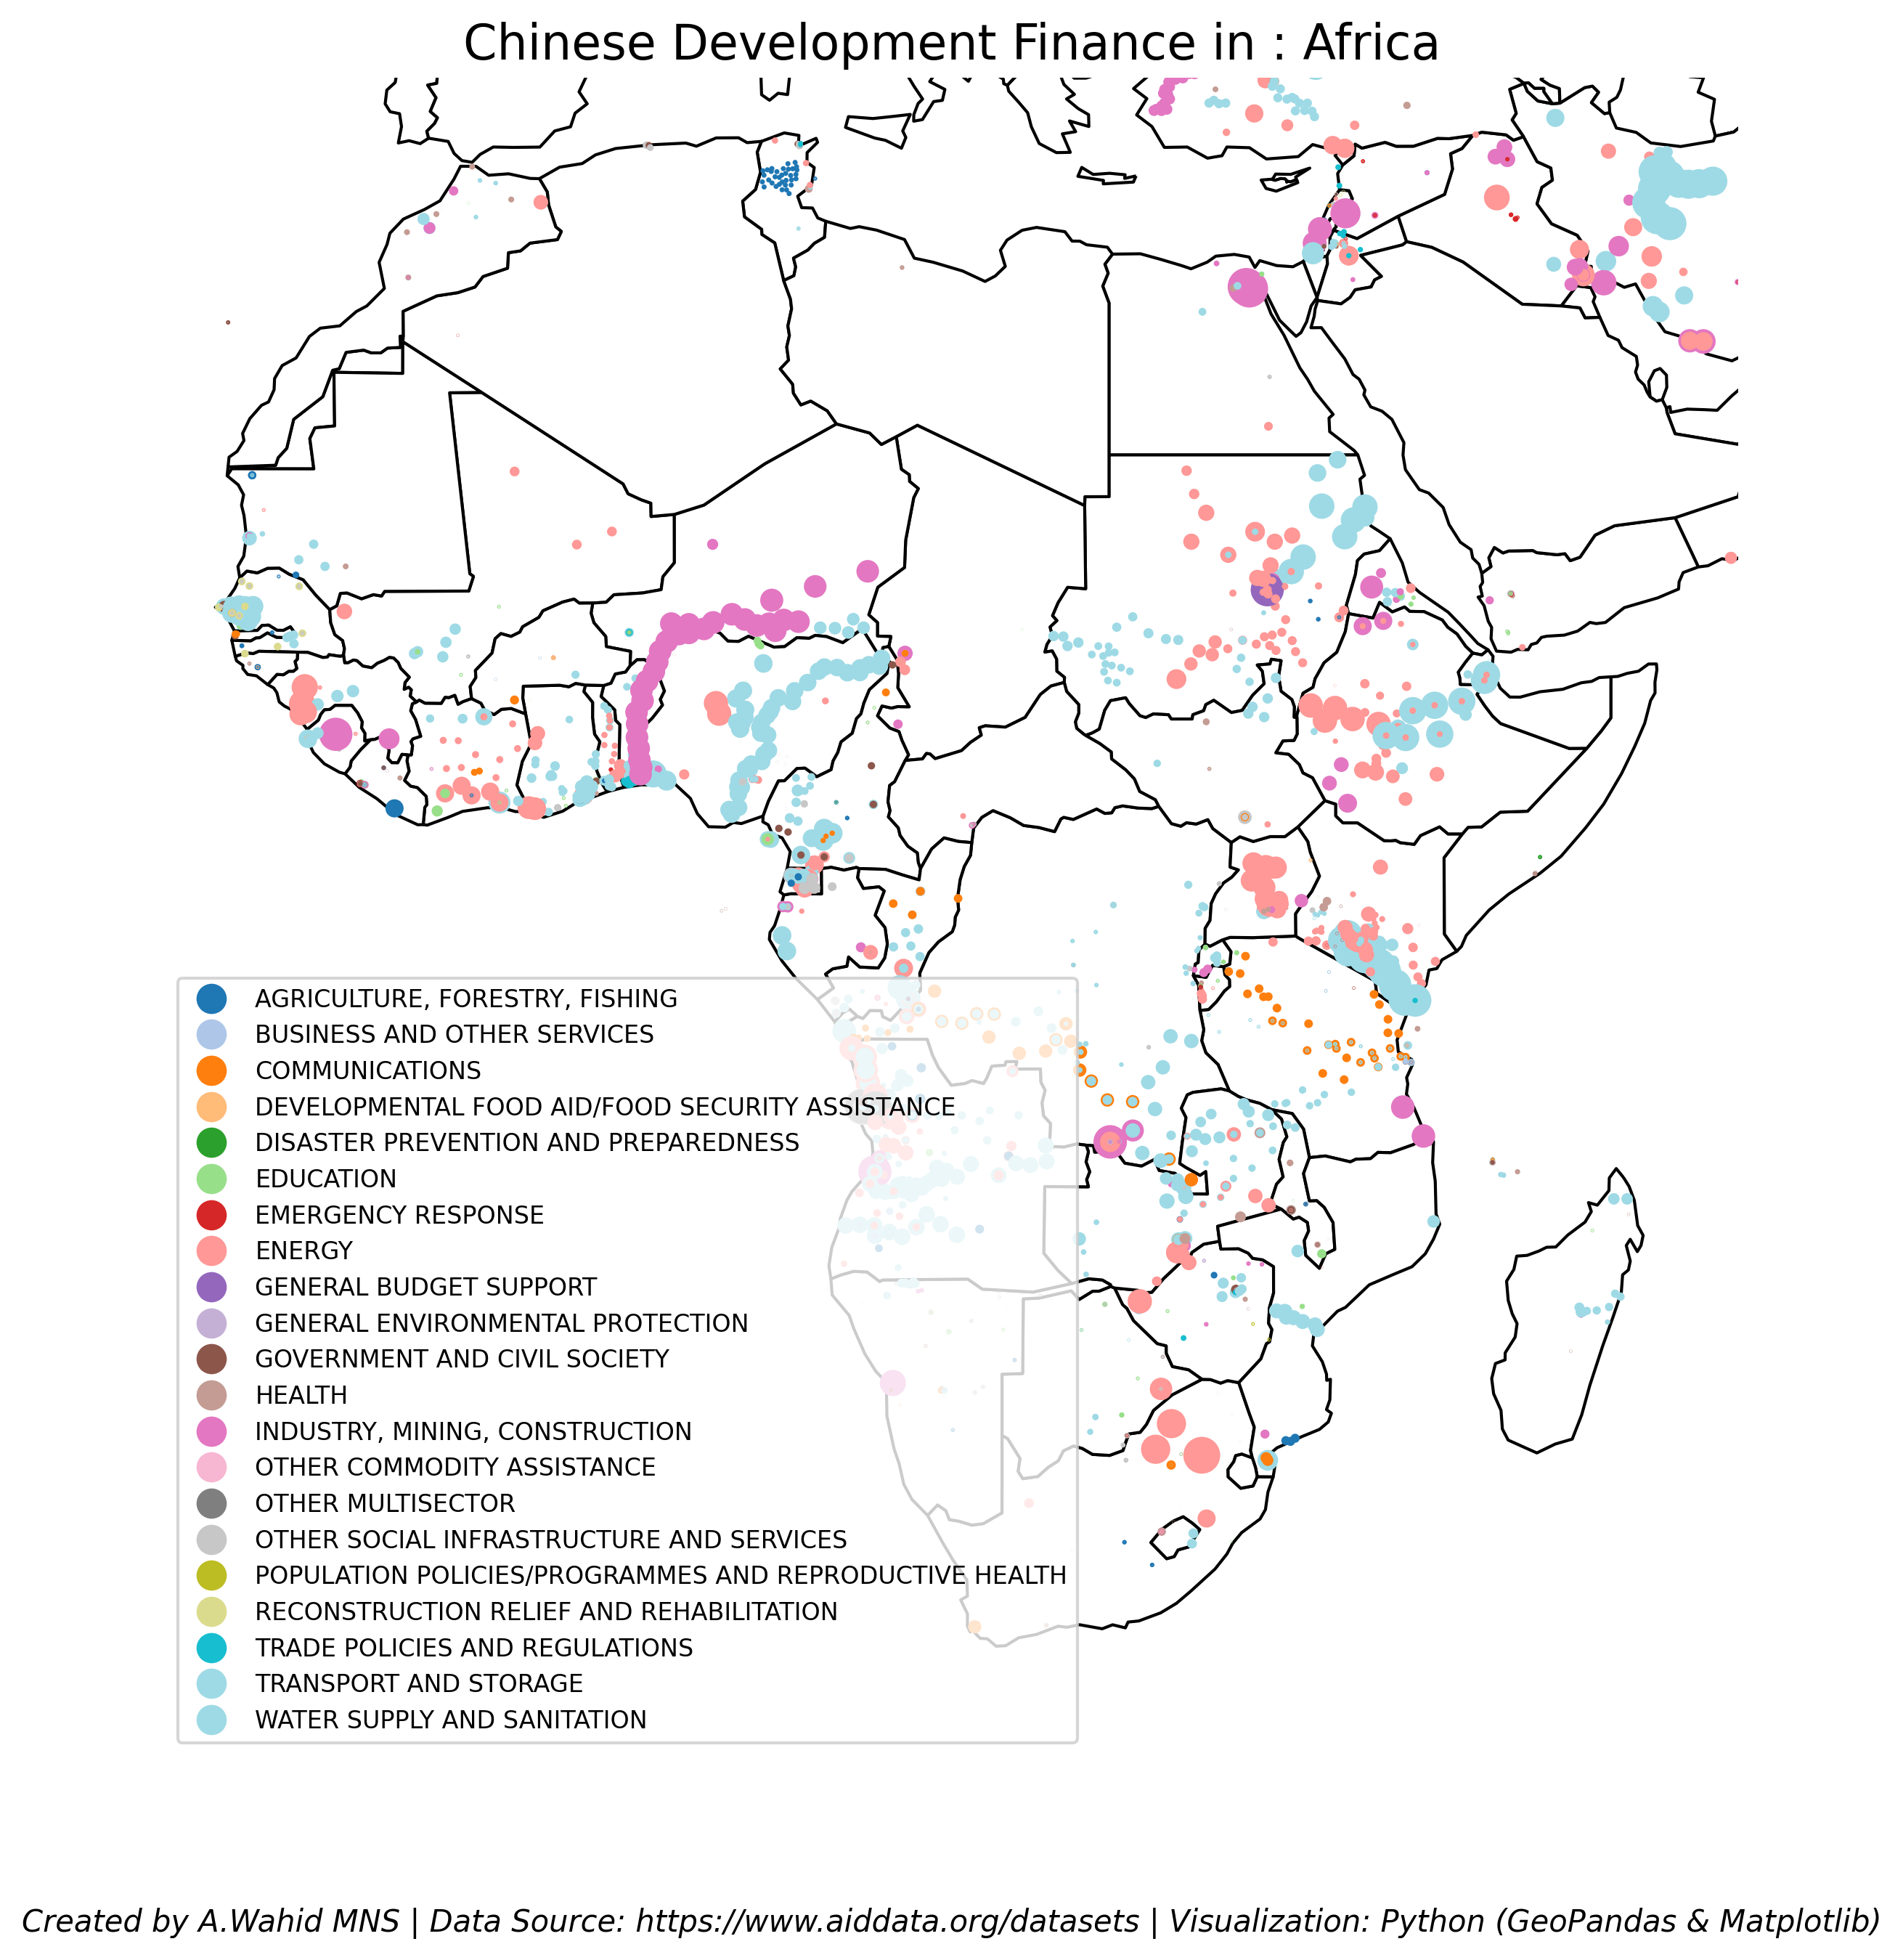
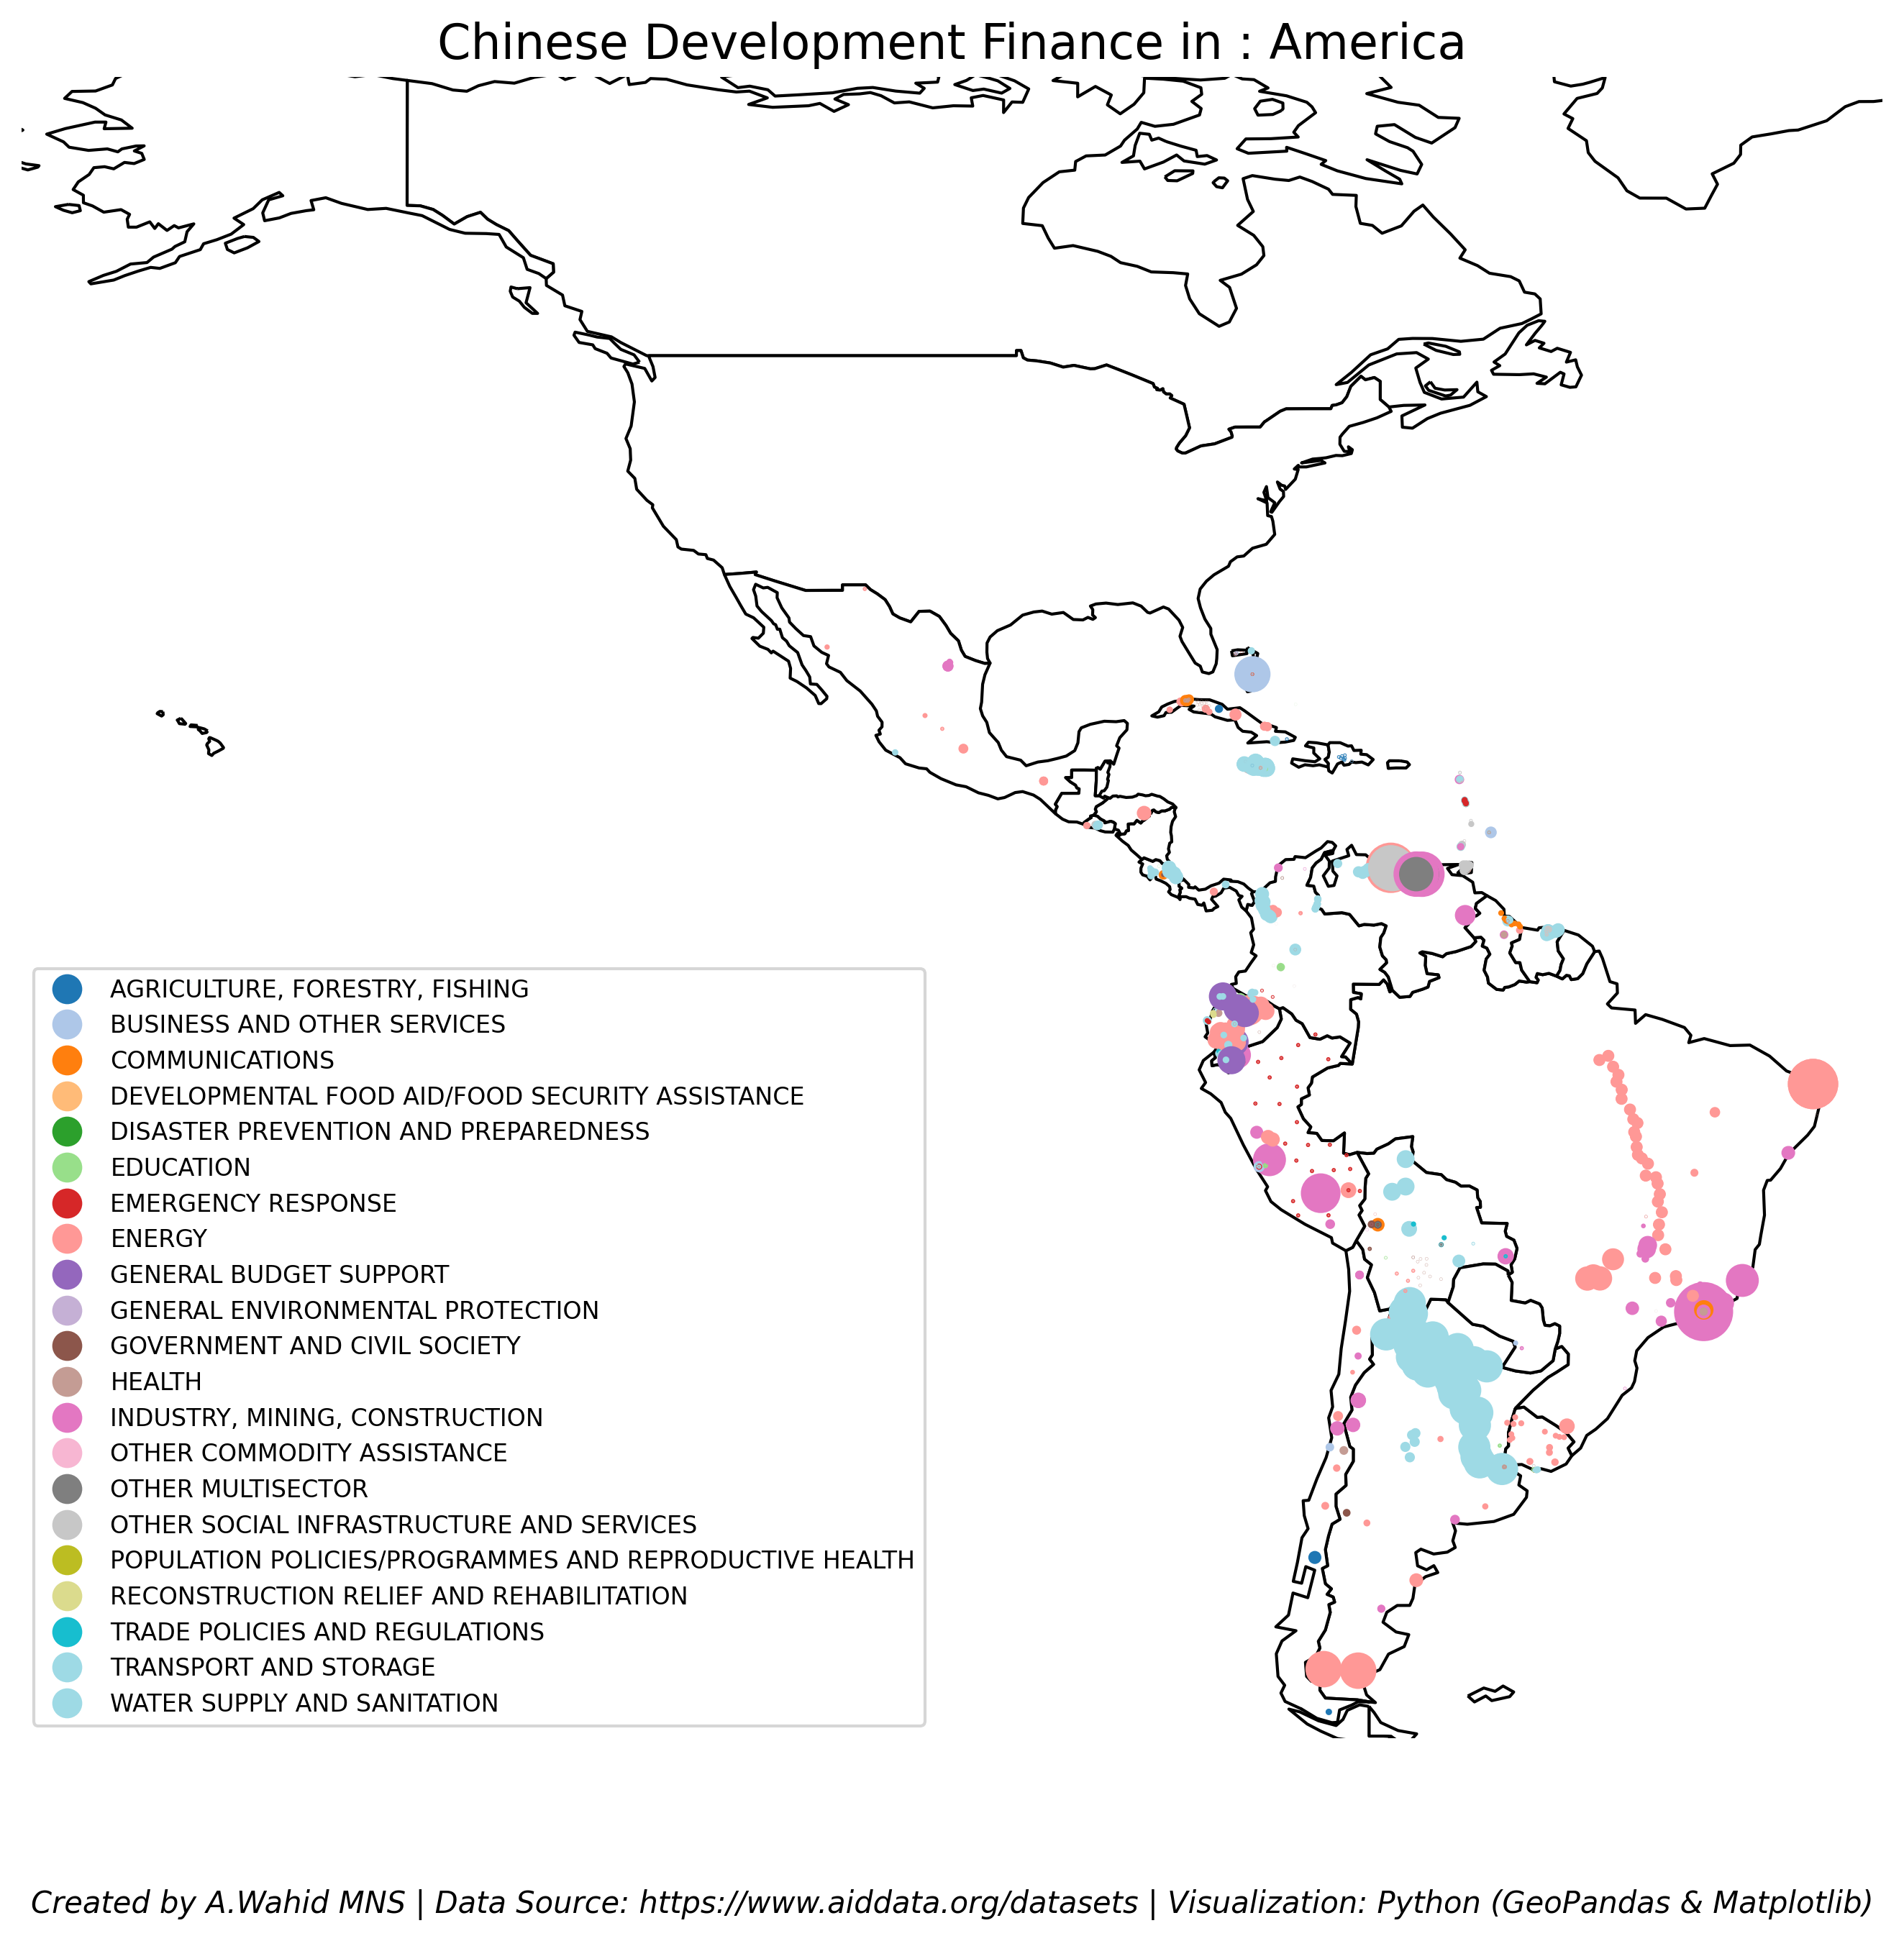
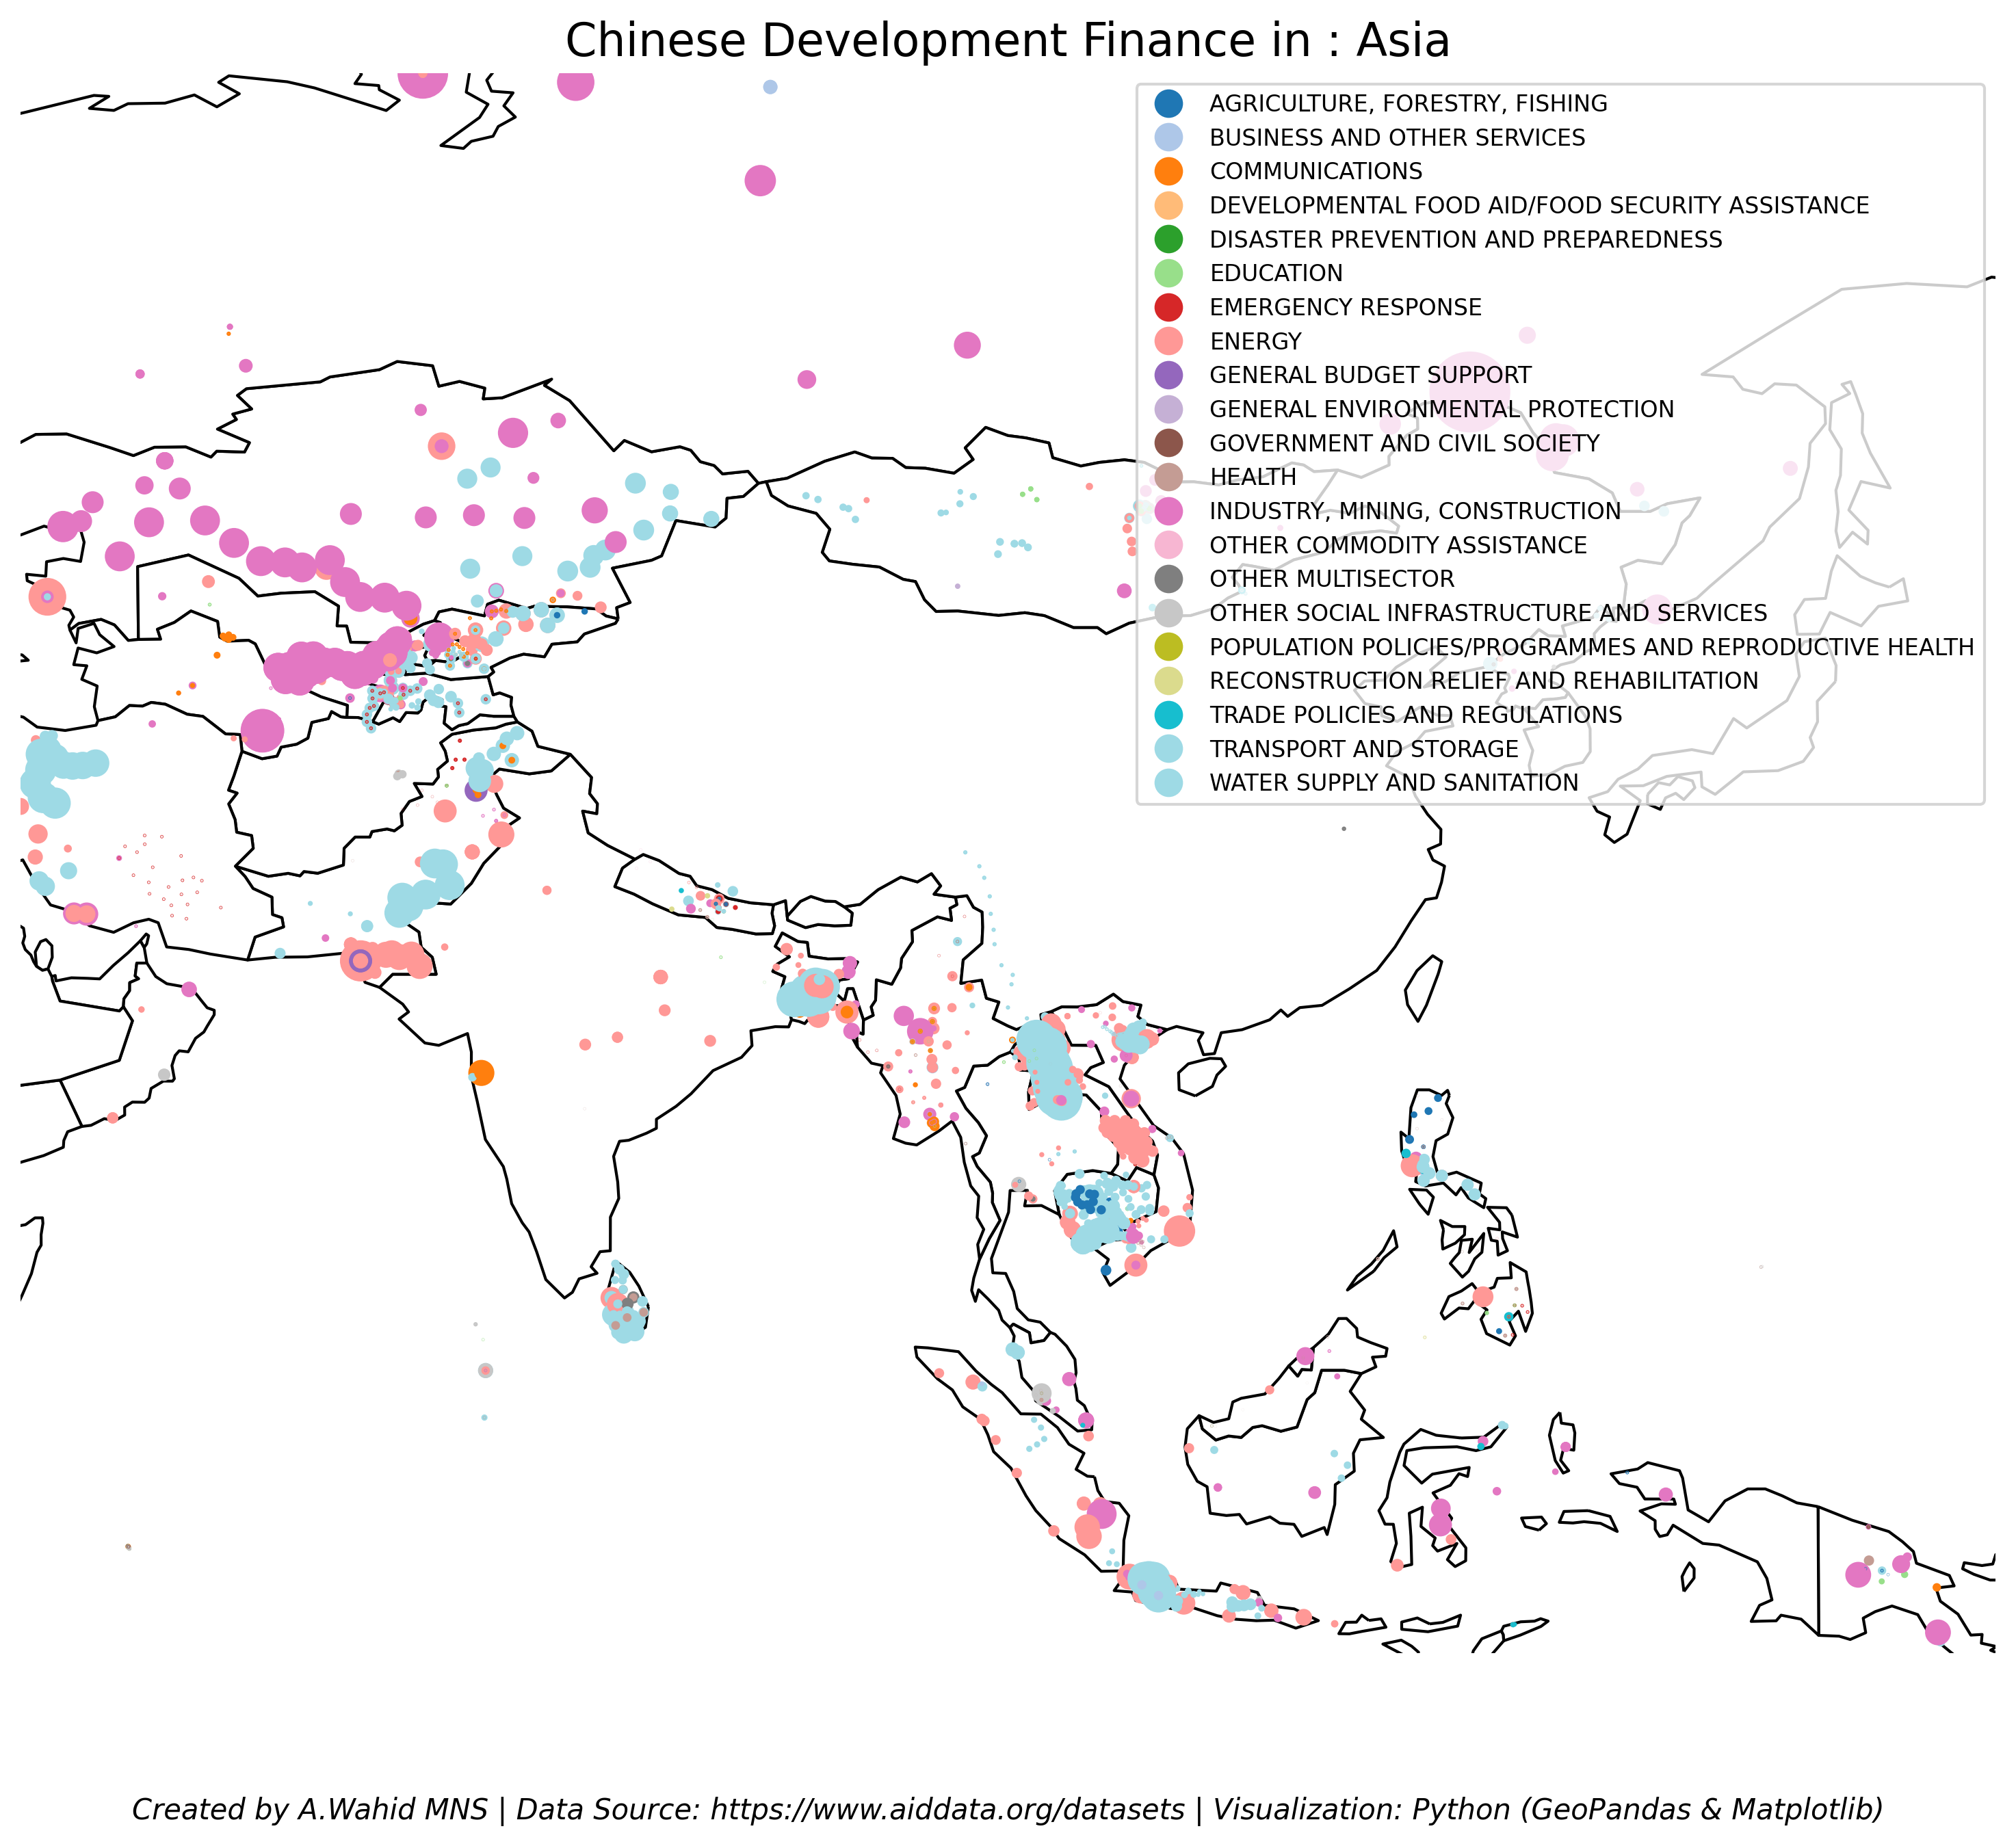
Regional Distribution
“Distribution of Chinese Financial Flows Across Africa”
“Distribution of Chinese Financial Flows Across America”
“Distribution of Chinese Financial Flows Across Asia”
Short-Term Dynamics
| Variables | Within (1) | Within (2) | Within (3) | Within (4) | IV (5) | IV (6) | IV (7) | IV (8) | AB (9) | AB (10) | AB (11) | AB (12) |
|---|---|---|---|---|---|---|---|---|---|---|---|---|
| Chinese_Flows | 0.018*** | 0.015*** | 0.005** | 0.003 | 0.627*** | 0.557*** | 0.393*** | 0.356*** | -0.000 | -0.001 | -0.001 | 0.000 |
| (Std. Error) | (0.004) | (0.003) | (0.002) | (0.002) | (0.049) | (0.056) | (0.068) | (0.085) | (0.004) | (0.003) | (0.002) | (0.002) |
| Lag1_GDP | -0.940*** | -0.732*** | -0.349*** | -0.289*** | ||||||||
| (0.118) | (0.111) | (0.118) | (0.099) | |||||||||
| Savings | 0.202*** | 0.071*** | 0.046*** | 0.106*** | 0.050** | 0.041*** | 0.135*** | 0.049*** | 0.037*** | |||
| (0.035) | (0.013) | (0.010) | (0.037) | (0.025) | (0.022) | (0.030) | (0.012) | (0.009) | ||||
| GFCF | 0.439*** | 0.276*** | 0.282*** | 0.229*** | 0.453*** | 0.293*** | ||||||
| (0.036) | (0.026) | (0.067) | (0.054) | (0.059) | (0.042) | |||||||
| FDI | 0.006 | 0.035*** | ||||||||||
| (0.005) | (0.010) | |||||||||||
| Trade | 0.305*** | 0.148* | 0.263*** | |||||||||
| (0.036) | (0.079) | (0.055) | ||||||||||
| Primary_Edu | -0.059 | 0.033 | -0.107* | |||||||||
| (0.065) | (0.108) | (0.057) | ||||||||||
| Inflation | -0.007 | -0.009 | -0.009 | |||||||||
| (0.007) | (0.020) | (0.008) | ||||||||||
| Rule_of_Law | 0.103*** | 0.060 | 0.107 | |||||||||
| (0.033) | (0.065) | (0.109) |
Notes:
Econometric Model Types:
- Within estimators (columns 1–4) are fixed-effects regressions.
- IV estimators (columns 5–8) use China’s steel production as an instrument.
AB estimators (columns 9–12) refer to Arellano-Bond dynamic panel models.
- Standard errors are in parentheses.
- * (p<0.10), ** (p<0.05), *** (p<0.01).
- Control variables include savings, gross fixed capital formation (GFCF), FDI, trade openness, primary education, inflation, and rule of law.
- (N=2148) in Arellano-Bond (AB) models. Missing data imputed at 10%.
- IV estimation uses China’s steel production as an instrument for Chinese financial flows.