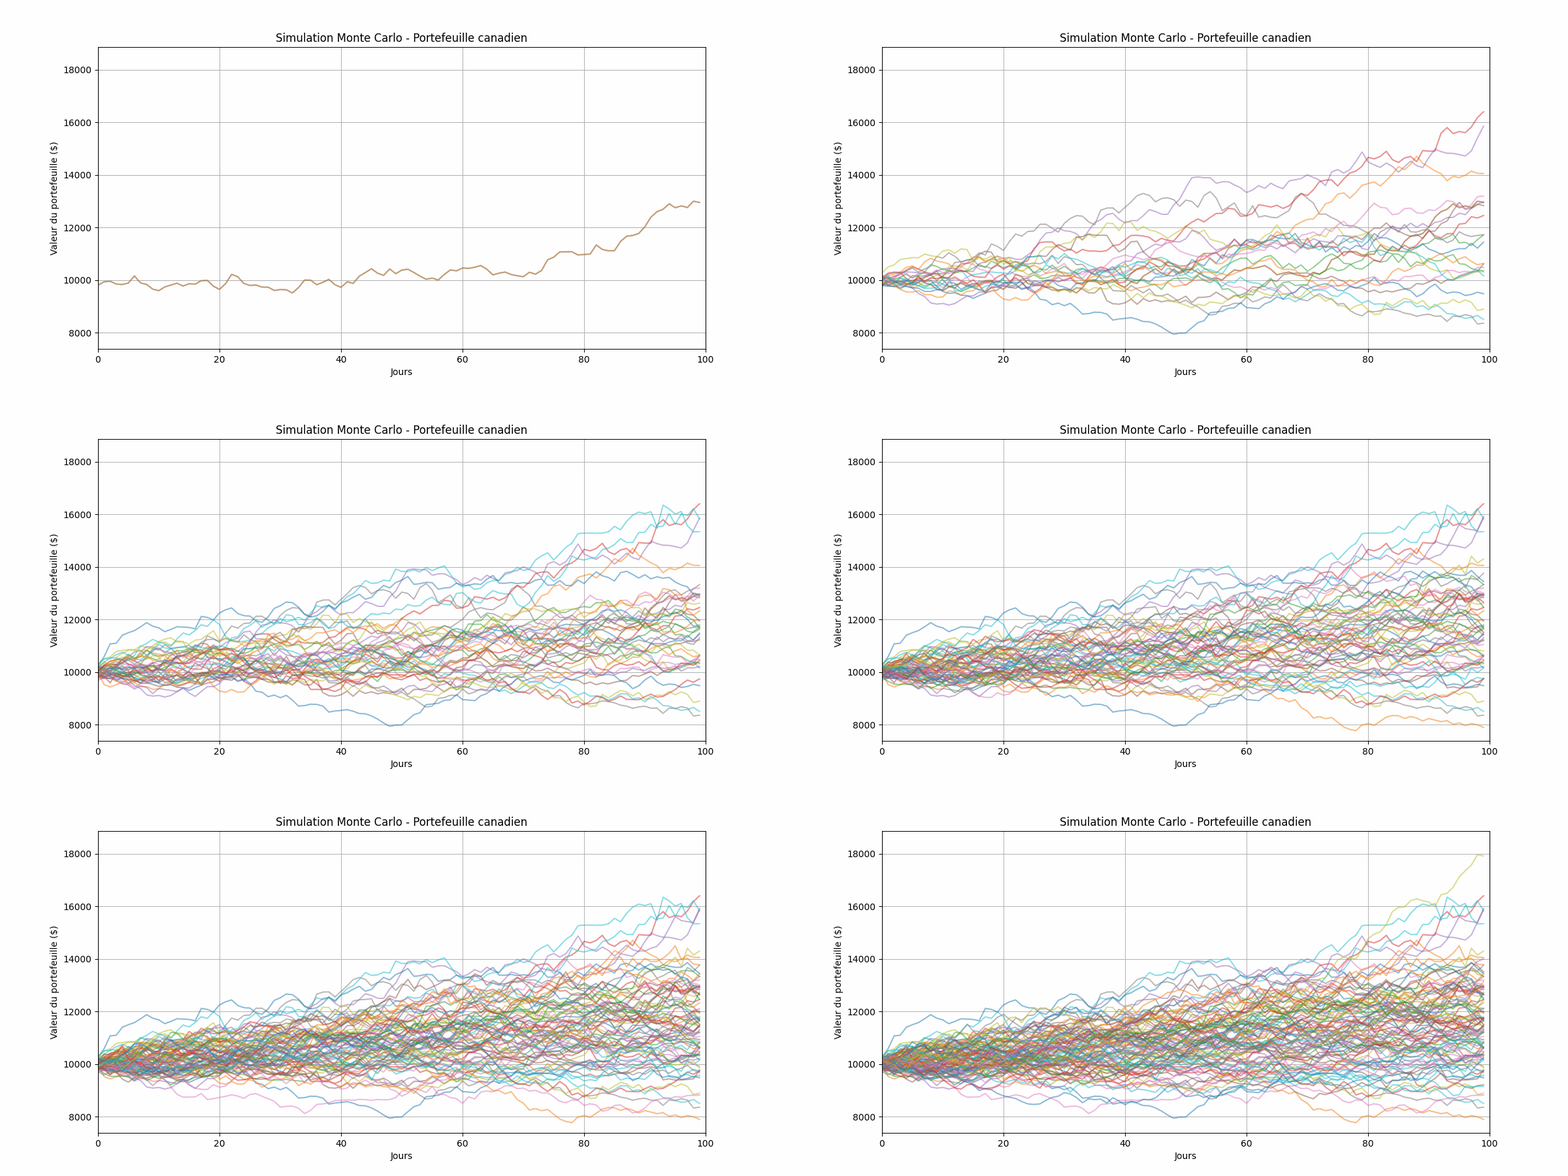
Monte Carlo Simulation of a Canadian Stock Portfolio
🧠 What does uncertainty look like? Maybe… something like this.
When we think about investing in stocks, ETFs, businesses—whatever it is—there’s always that little voice in our heads:
- “What if it drops tomorrow?”
- “What if I had bought in earlier?”
- “What if I hadn’t sold?”
- “What if… I had known?”
So, I decided to stop ignoring it.
Using a small Python algorithm, I explored 200 plausible futures of a Canadian stock portfolio 🇨🇦 (RBC, Shopify, TD, Barrick Gold—good old TSX).
📊 Each scenario follows its own path, shaped by:
- historical data,
- expected returns,
- volatility, and
- correlations between stocks.
🎢 The result: a ballet of curves
- Some paths skyrocket 📈
- Others plummet 📉
- None of them are the truth… but all of them are possible
👨💻 Tools used:
Pythonpandas,numpy,matplotlibyfinancefor stock market data
📷 Visualization:

🏷️ Tags:
#Investing, #Simulation, #MonteCarlo, #Finance, #Python, #Risk, #DataViz, #Canada, #TSX
💬 If you’ve ever wondered what uncertainty might look like… well, it might look something like this.
