🔍 Understanding how governments raise revenue (direct/indirect taxes and other sources) is central to fiscal capacity and development.
🧭 Objective
Offer a clear, comparative view of revenue structures over time to support fiscal analysis and policy discussions.
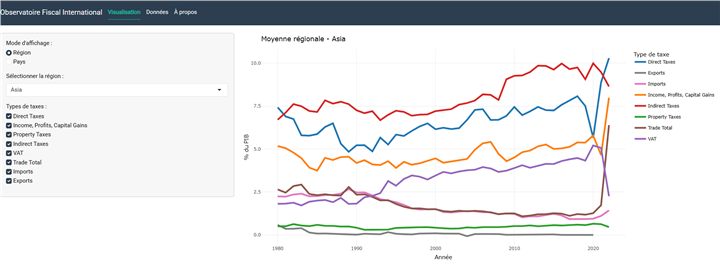
📊 Visualization
🧰 What the app does
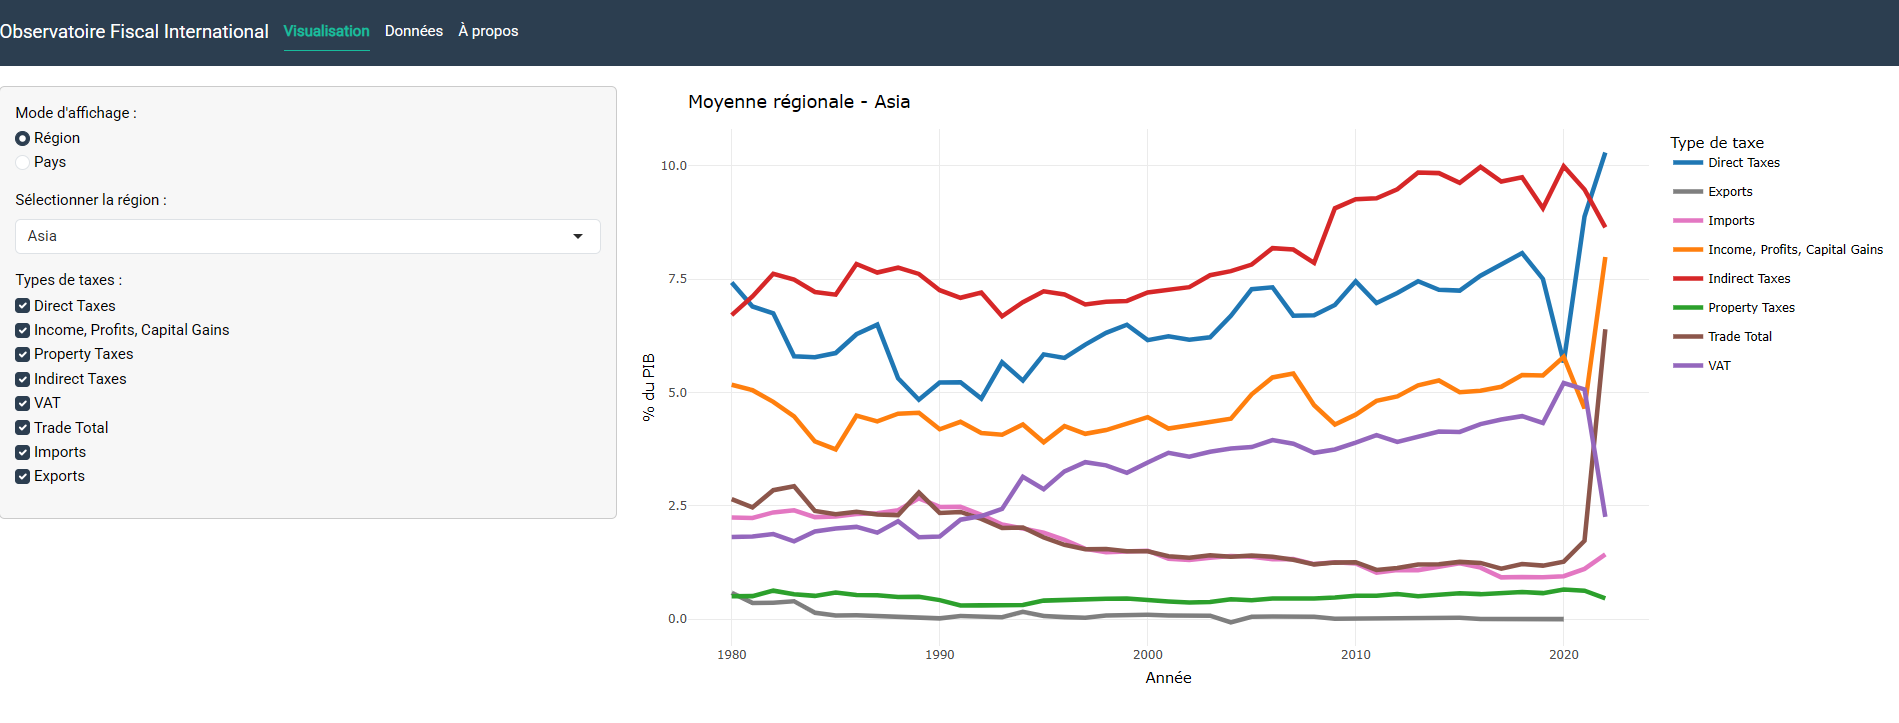
- Decompose revenue by tax type: direct taxes, indirect taxes, taxes on international trade, VAT, and the remaining sources.
- Follow each component over time: see how the share of every tax type in GDP has moved, rather than reading a single year.
- Filter by region and country: compare fiscal structures across groups of economies, or drill down to one.
- Exportable tables behind each view.
📚 Data & tools
- Source: UNU-WIDER Government Revenue Dataset
- Period: ~1980–2022 (coverage varies by country)
- Tools: R, Shiny,
tidyverse,plotly,DT
🎯 Who it is for
- Ministries of Finance monitoring domestic revenue mobilisation
- Analysts and researchers needing quick comparative views of fiscal structure
- Students and practitioners learning public finance from real data
📱 A note on mobile
On a smartphone, turn the device to landscape: the time-series panels need the width.
💬 Feedback
Remarks, suggestions and ideas for improvement are always welcome.
🗓 Completion
April 2025