
MACD + SMA Backtesting (2015–2024)
🔍 Project Overview
This project applies systematic backtesting to evaluate a well-known technical trading rule: the MACD crossover strategy, enriched with simple moving averages (SMA 10/20) for trend context.
Backtesting means simulating how a portfolio would have evolved if a given strategy had been applied to historical price data.
It allows us to test:
- when trades would have been triggered,
- how capital would have grown or declined,
- and what risk/return characteristics the strategy generates.
📉 The Trading Strategy
The core of the system is the MACD crossover rule:
- MACD line = EMA(12) – EMA(26)
- Signal line = EMA(9) of MACD
- Trading rules:
- Buy when MACD crosses above the signal line.
- Sell when MACD crosses below the signal line.
Two versions were tested:
- Long-only mode → stay in cash when a sell signal appears.
- Long & short mode → reverse position (switch between long and short) on every crossover.
In addition, SMA(10) and SMA(20) are plotted directly on the price chart to provide extra context on short-term trend direction.
🧰 Methodology
- Assets tested:
Tesla (TSLA), Nvidia (NVDA), Apple (AAPL), Microsoft (MSFT), Amazon (AMZN) - Period covered: 2015-01-01 → 2024-12-31
- Data source: Yahoo Finance (
yfinance) - Indicators used: MACD, Signal line, SMA(10), SMA(20)
- Tools:
backtesting.pyfor simulation,pandas,numpyfor data manipulation,TA-Lib(when available, otherwise custom NumPy EMAs),bokehfor interactive visualization.
Technical improvements implemented:
- Batch downloading of multiple tickers (reduces Yahoo rate-limit issues).
- Local CSV caching (avoids unnecessary repeated downloads).
- Retry logic with exponential backoff.
- Automatic generation of:
- interactive HTML reports (equity curve, OHLC, trades, indicators),
- CSV logs with entry/exit details (time, size, PnL, returns).
📊 Example Visualization
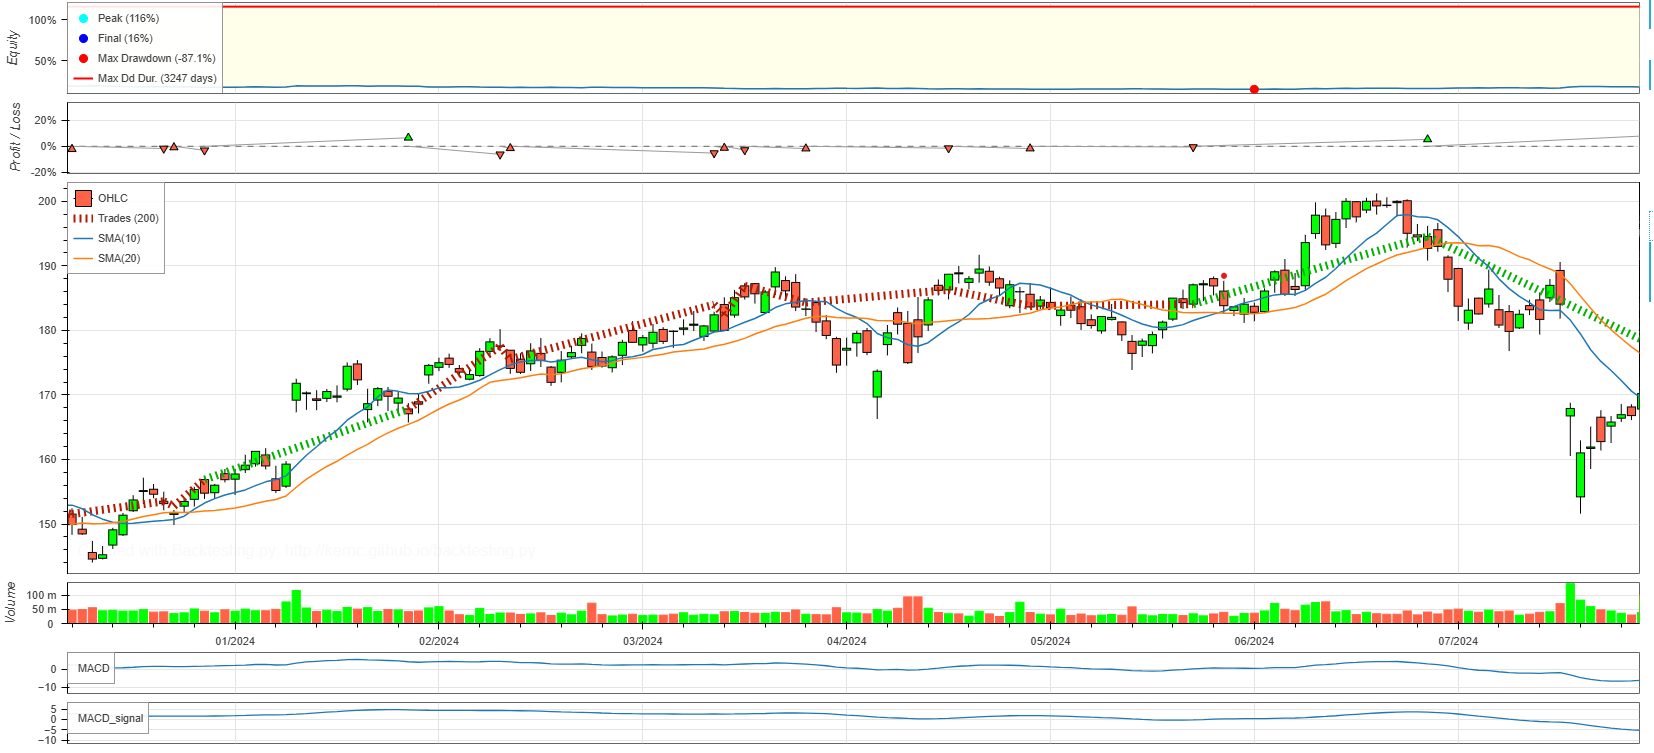
Legend:
- OHLC candles = price movements
- SMA(10) & SMA(20) = short-term moving averages
- Red/green arrows = trades (entries/exits)
- Lower panels = MACD line & signal line
📈 Key Results
Each run produces a performance summary with:
- Final return & CAGR (annualized growth rate)
- Annualized volatility
- Sharpe, Sortino, and Calmar ratios
- Maximum drawdown (loss from peak to trough)
- Win rate, average trade return, and profit factor
Example (TSLA 2015–2024, long+short):
- CAGR ≈ X%
- Sharpe ratio ≈ Y
- Max drawdown ≈ Z%
- Profit factor ≈ ~2.0
(exact values vary depending on execution and commission settings)
🧠 Why It Matters
This project demonstrates how a technical trading rule can be implemented and tested in Python from scratch.
It shows:
- how to integrate market data acquisition,
- how to design and code a strategy class,
- how to produce risk/performance metrics,
- and how to visualize both equity curves and indicator dynamics.
Even if the strategy itself is relatively simple, the exercise builds a reusable framework for testing more advanced trading rules, combinations of indicators, or risk management overlays.
⚠️ Limitations & Next Steps
No backtest is perfect. This study comes with important caveats:
- Transaction costs & slippage: only commissions were modeled; real execution may differ.
- Sideways markets: MACD crossovers can generate many false signals when prices move sideways.
- Overfitting risk: parameters (12, 26, 9) are conventional, but optimizing them excessively risks fitting noise.
- Survivorship bias: only current large-cap stocks were tested; results may not generalize to delisted or smaller firms.
- No risk overlays: position sizing, stop-loss rules, and portfolio constraints were not included.
Next steps could involve:
- Out-of-sample testing (split data into training/test).
- Running the strategy on intraday data.
- Adding volatility filters (e.g., ATR-based position sizing).
- Combining MACD with other signals (RSI, volume indicators).
- Portfolio-level backtesting (dynamic allocation between tickers).
📚 Suggested Readings
For readers interested in technical trading rules and their evaluation:
- Brock, W., Lakonishok, J., & LeBaron, B. (1992). Simple technical trading rules and the stochastic properties of stock returns. The Journal of Finance, 47(5), 1731-1764.
- Park, C. H., & Irwin, S. H. (2007). What do we know about the profitability of technical analysis? Journal of Economic Surveys, 21(4), 786-826.
- Murphy, J. (1999). Technical Analysis of the Financial Markets. (classic practitioner’s reference).
- Prado, M. L. de (2018). Advances in Financial Machine Learning. (for modern extensions).
🏷️ Tags
#Backtesting #QuantFinance #Python #MACD #SMA #TechnicalAnalysis #TradingStrategy #DataScience